Graph and data questions

Questions that turn on reading a graph, table or spectrum. 46 questions.

Other types: Multiple-choice questions · Calculation questions · Equation questions · Mechanism questions · Structure and isomer questions · Six-mark level of response questions · Practical questions · Short-answer questions

June 2025 · AS Paper 1 · Q21(d)(ii) 3 marks Data interpretation Medium reaction rates
Earlier part of question 21 that this part usesEarlier part of June 2025 Paper 1 question 21
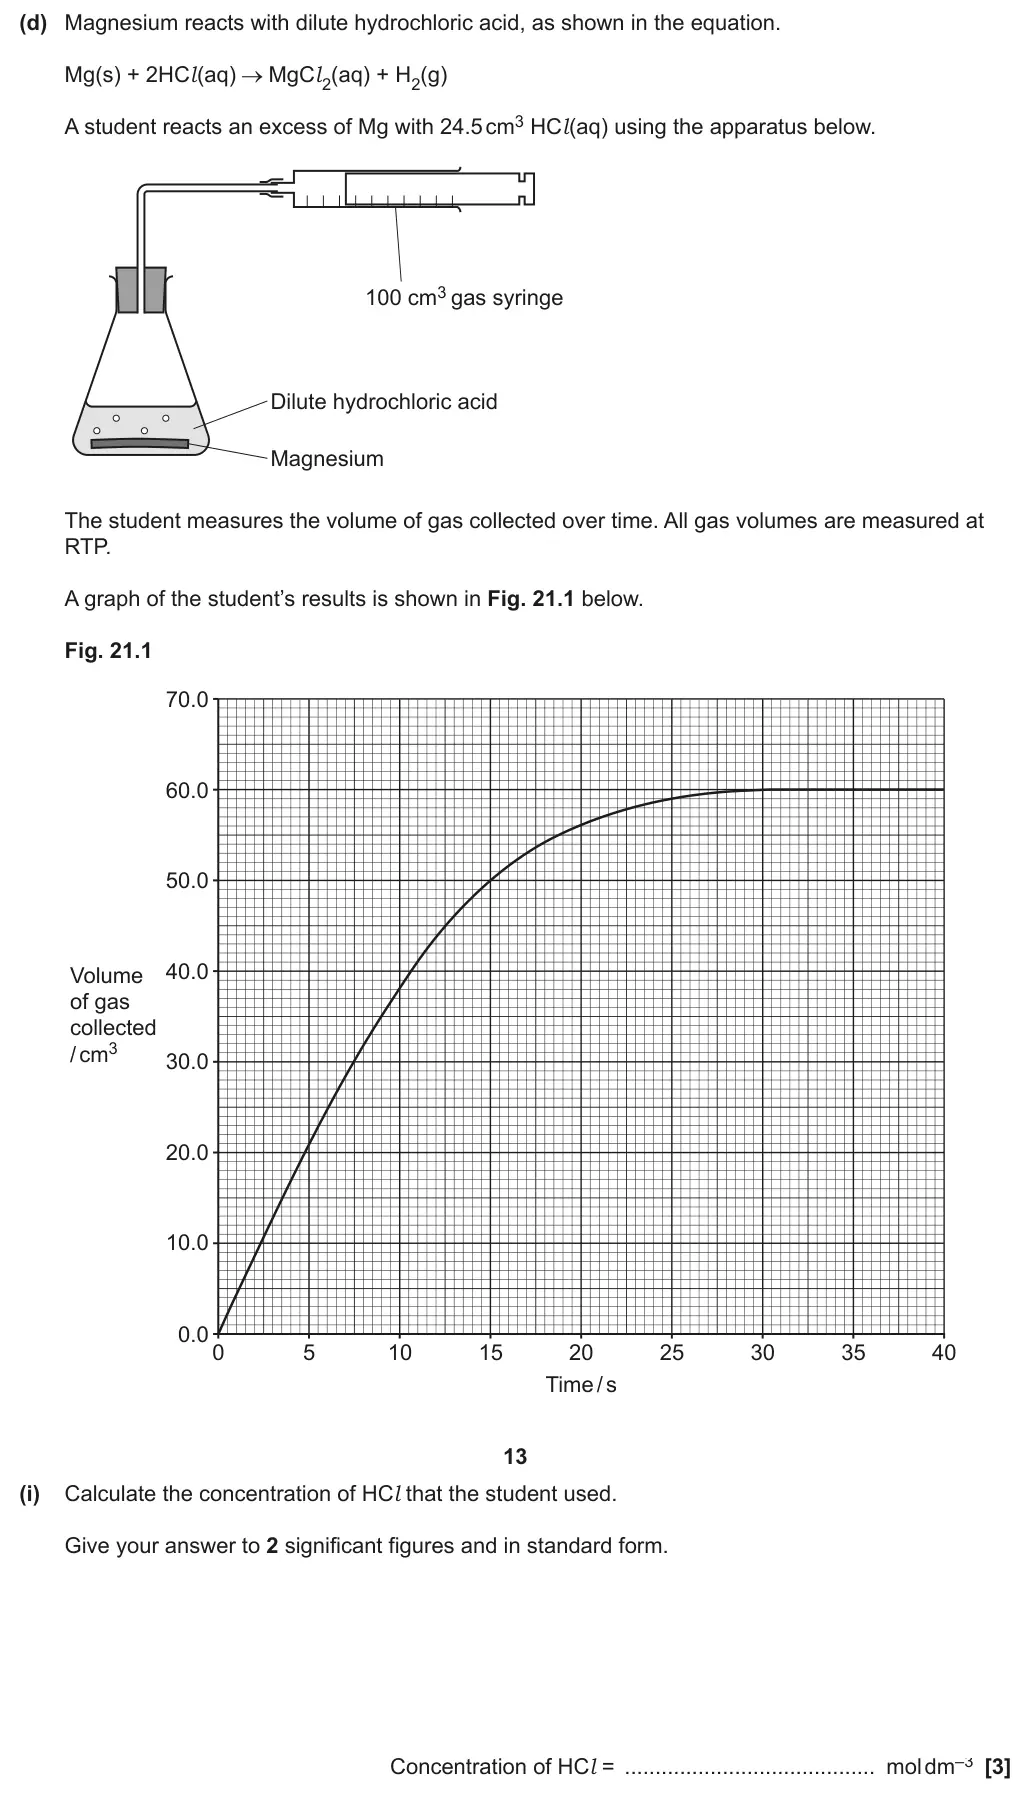
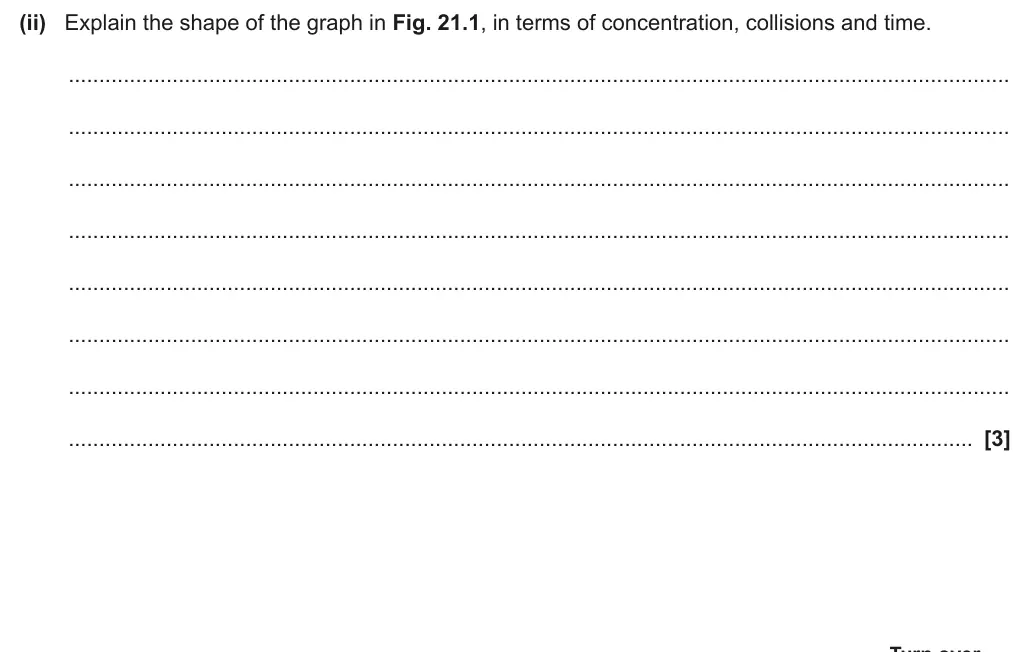
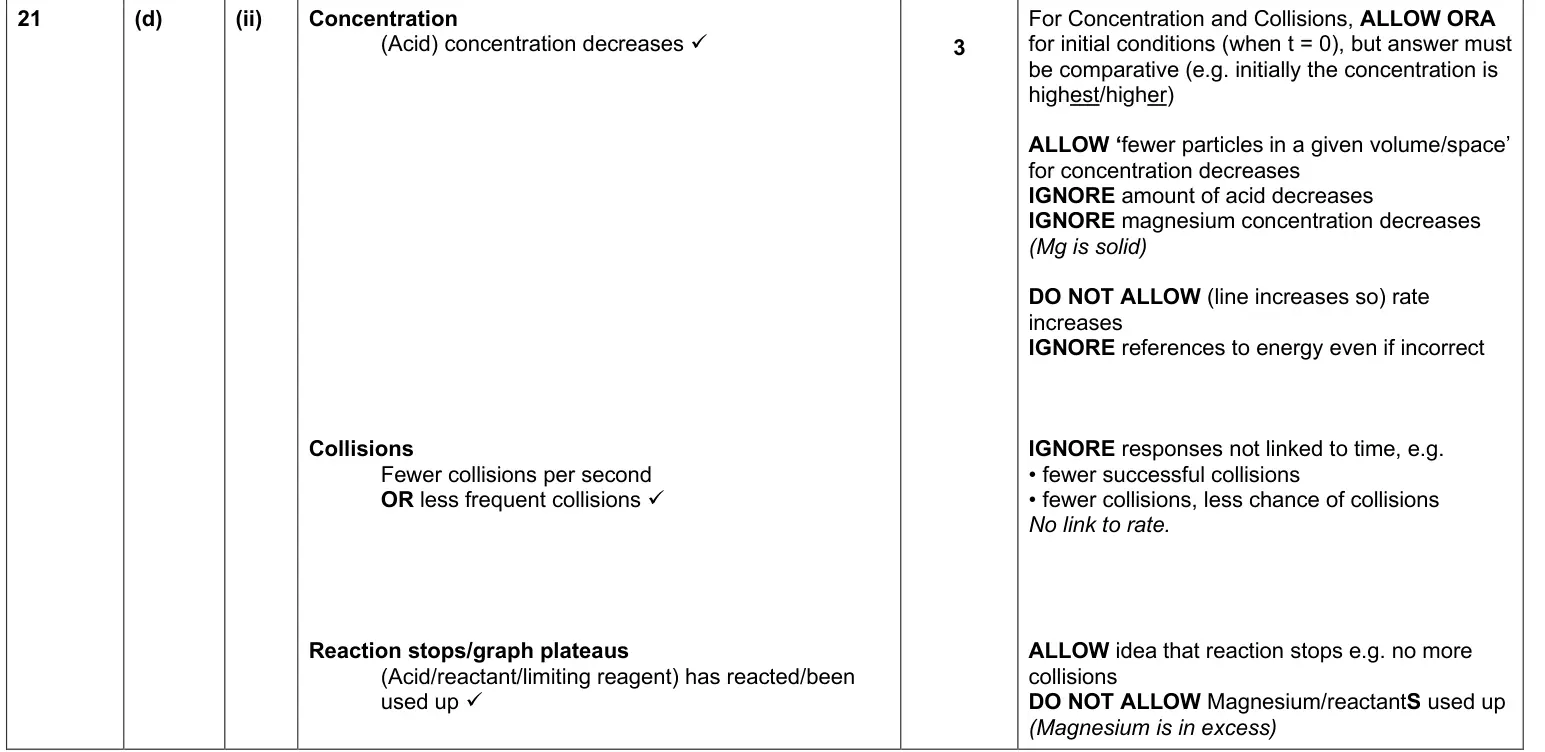
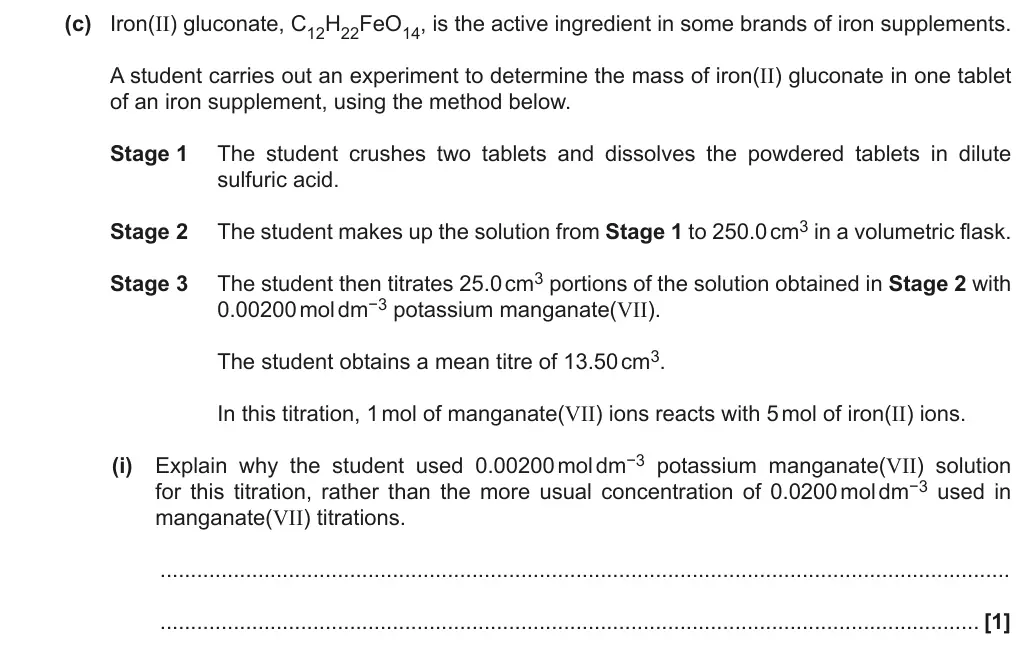
(ii) Explain the shape of the graph in Fig. 21.1, in terms of concentration, collisions and time.
..........................................................................................................................................................
..........................................................................................................................................................
..........................................................................................................................................................
..........................................................................................................................................................
..........................................................................................................................................................
..........................................................................................................................................................
..........................................................................................................................................................
.................................................................................................................................................... [3]
June 2025 · AS Paper 2 · Q4(a) 4 marks Data interpretation Medium alkanes
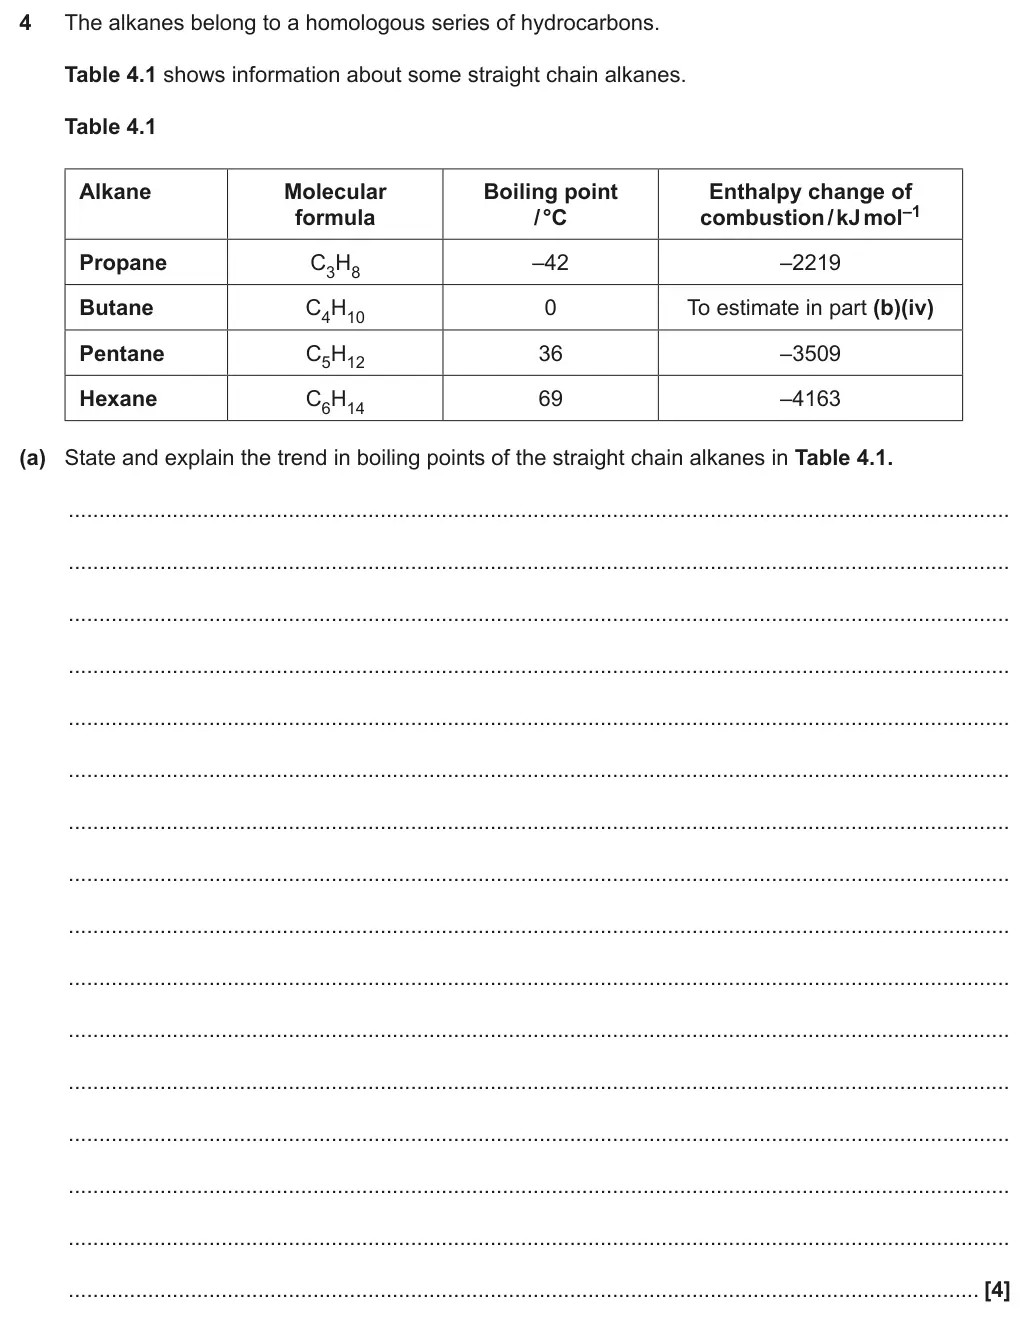
4 The alkanes belong to a homologous series of hydrocarbons.
Table 4.1 shows information about some straight chain alkanes.
Table 4.1
Alkane Molecular Boiling point Enthalpy change of
formula / °C combustion / kJ mol–1
Propane C3H8 –42 –2219
Butane C4H10 0 To estimate in part (b)(iv)
Pentane C5H12 36 –3509
Hexane C6H14 69 –4163
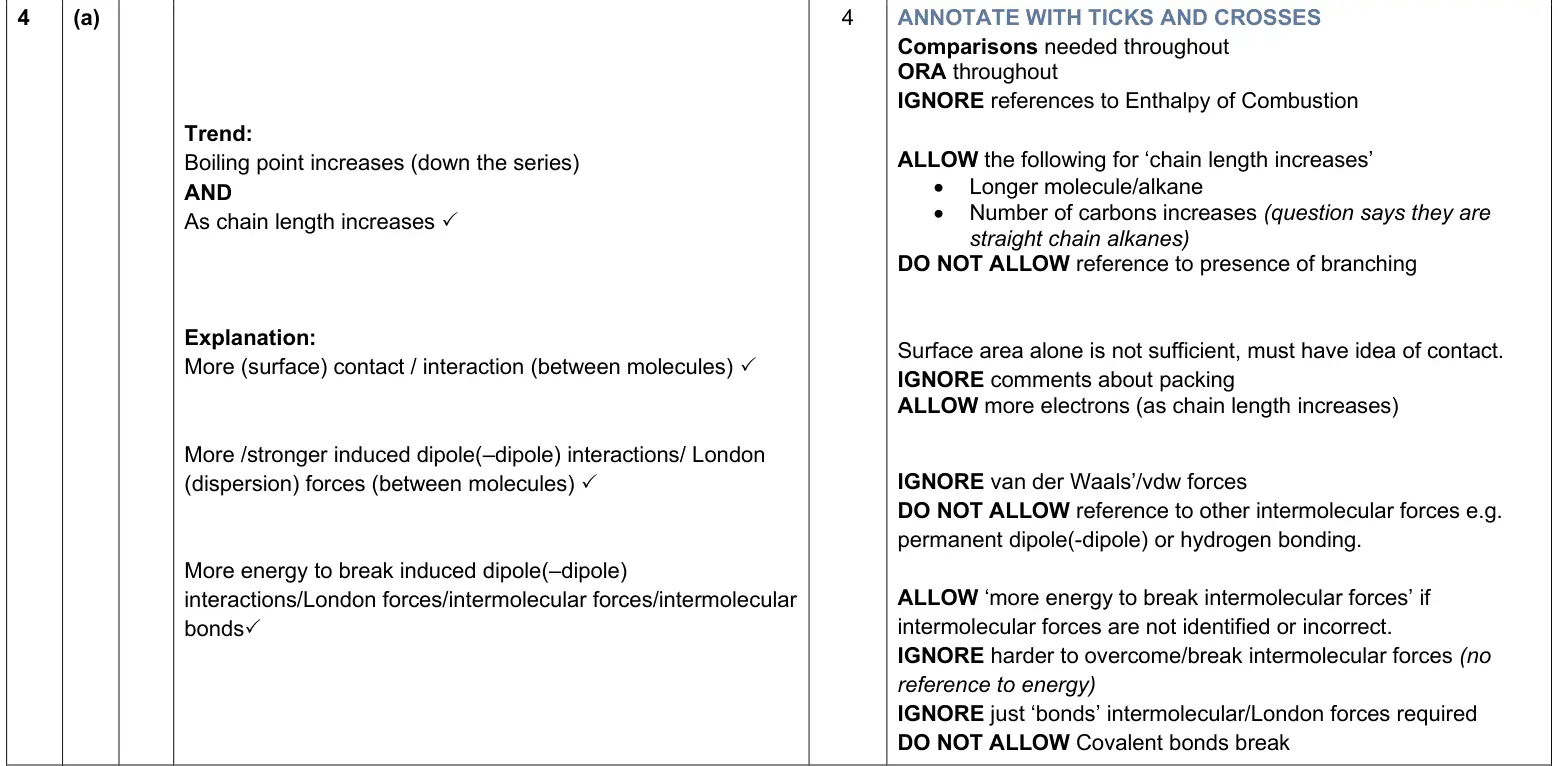
(a) State and explain the trend in boiling points of the straight chain alkanes in Table 4.1.
..........................................................................................................................................................
..........................................................................................................................................................
..........................................................................................................................................................
..........................................................................................................................................................
..........................................................................................................................................................
..........................................................................................................................................................
..........................................................................................................................................................
..........................................................................................................................................................
..........................................................................................................................................................
..........................................................................................................................................................
..........................................................................................................................................................
..........................................................................................................................................................
..........................................................................................................................................................
..........................................................................................................................................................
..........................................................................................................................................................
..................................................................................................................................................... [4]
June 2025 · AS Paper 2 · Q4(b)(iv) 1 mark Data interpretation Hard enthalpy changesorganic basics
Earlier part of question 4 that this part usesEarlier part of June 2025 Paper 2 question 4
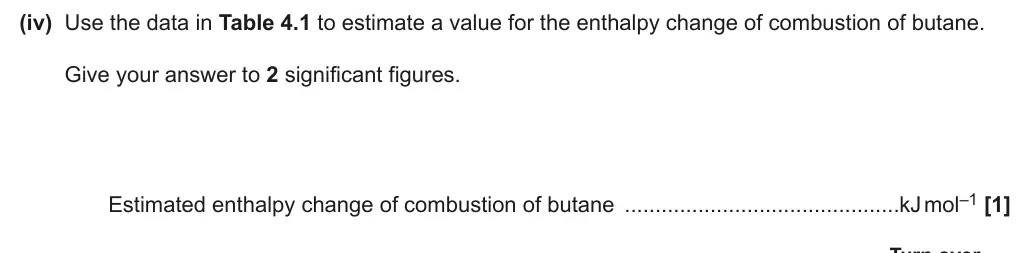
(iv) Use the data in Table 4.1 to estimate a value for the enthalpy change of combustion of butane.
Give your answer to 2 significant figures.
Estimated enthalpy change of combustion of butane  .............................................kJ mol–1 [1]
June 2025 · Paper 1 · Q19(b)(ii) 3 marks Data interpretation Easy halogensredox
Earlier part of question 19 that this part usesEarlier part of June 2025 Paper 1 question 19
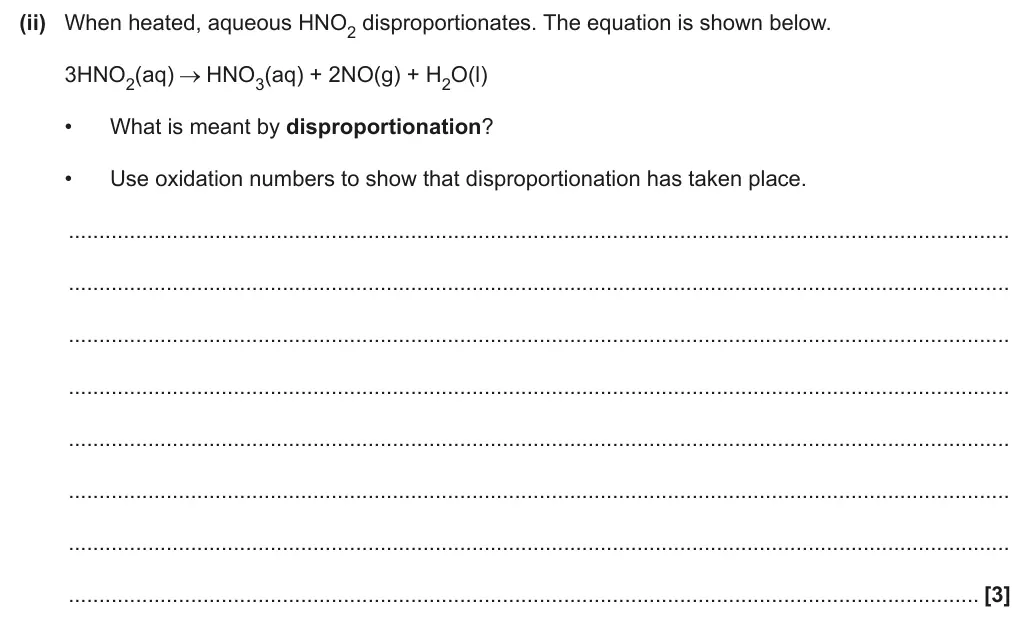
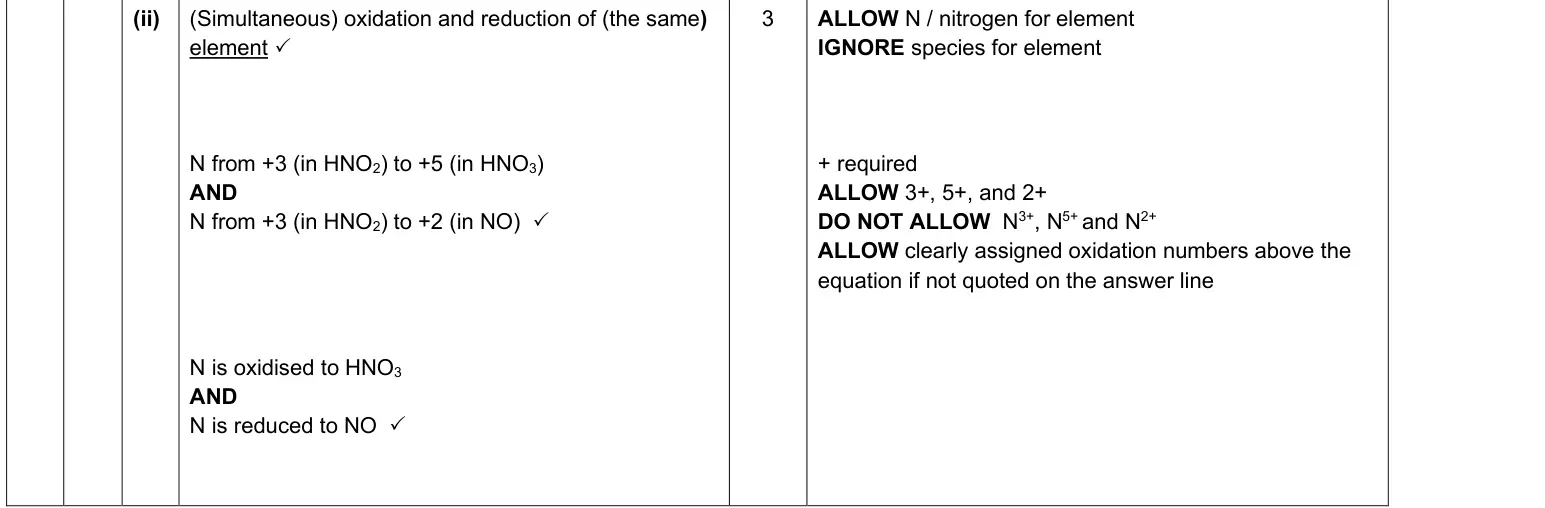
(ii) When heated, aqueous HNO2 disproportionates. The equation is shown below.
3HNO2(aq) HNO3(aq) + 2NO(g) + H2O(l)
• What is meant by disproportionation?
• Use oxidation numbers to show that disproportionation has taken place.
..........................................................................................................................................................
..........................................................................................................................................................
..........................................................................................................................................................
..........................................................................................................................................................
..........................................................................................................................................................
..........................................................................................................................................................
..........................................................................................................................................................
..................................................................................................................................................... [3]
June 2025 · Paper 1 · Q21(b)(ii) 4 marks Data interpretation Medium amount of substancetransition elements
Earlier part of question 21 that this part usesEarlier part of June 2025 Paper 1 question 21
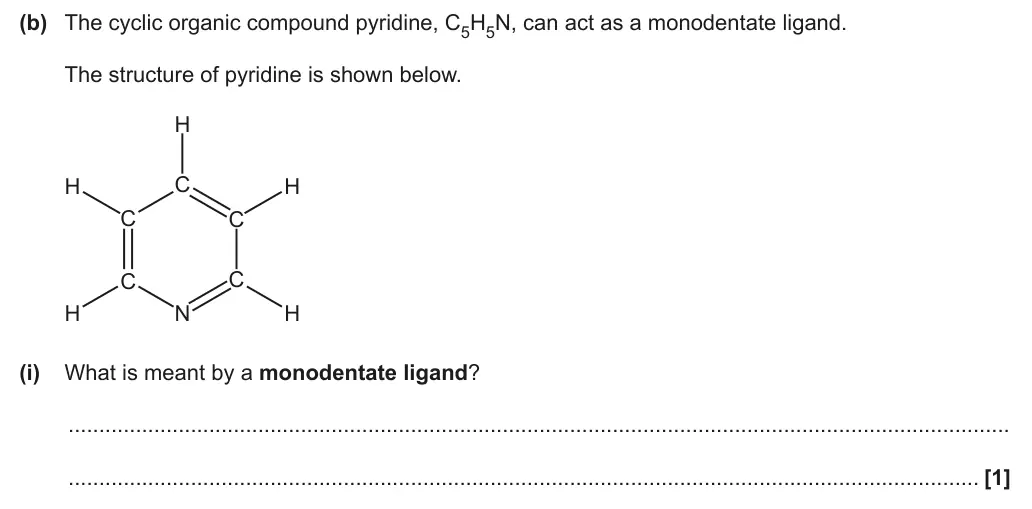
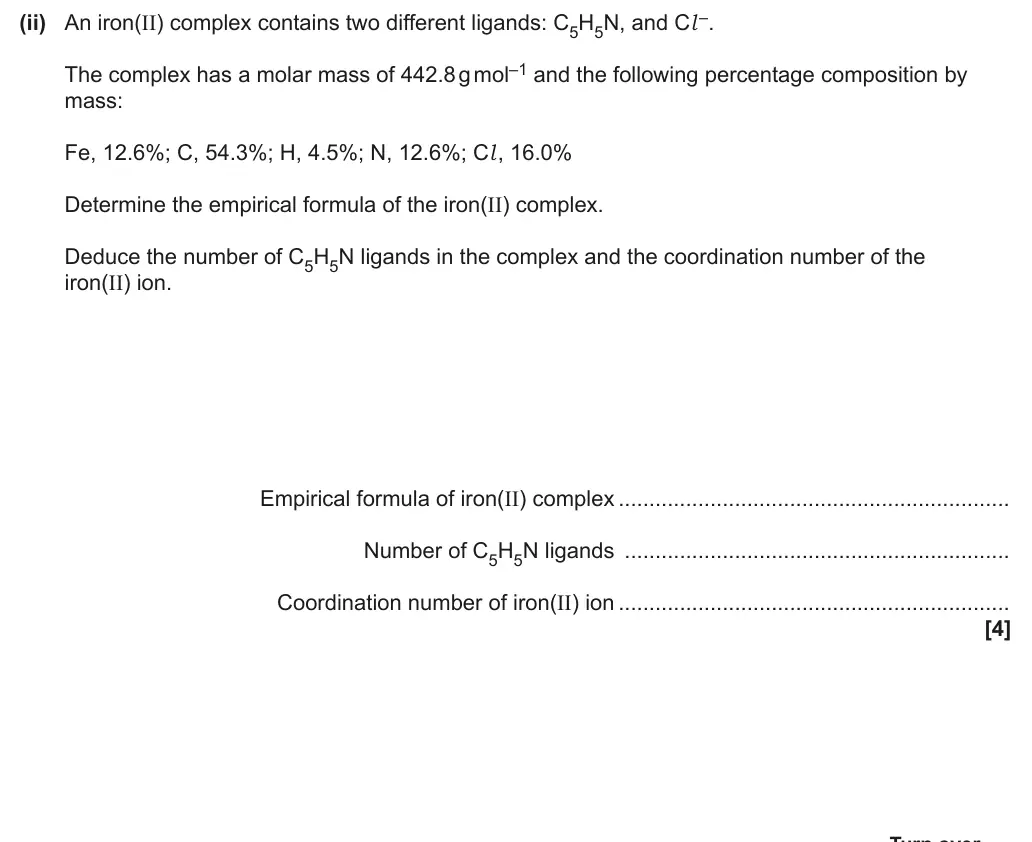
(ii) An iron(II) complex contains two different ligands: C5H5N, and Cl –.
The complex has a molar mass of 442.8 g mol–1 and the following percentage composition by
mass:
Fe, 12.6%; C, 54.3%; H, 4.5%; N, 12.6%; Cl , 16.0%
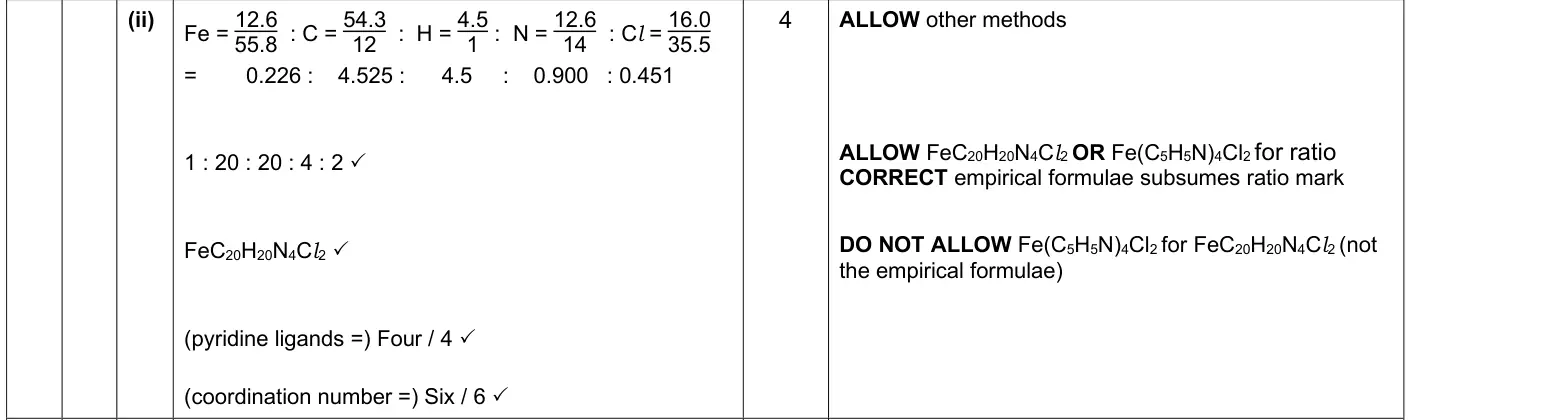
Determine the empirical formula of the iron(II) complex.
Deduce the number of C5H5N ligands in the complex and the coordination number of the
iron(II) ion.
Empirical formula of iron(II) complex ................................................................
Number of C5H5N ligands  ...............................................................
Coordination number of iron(II) ion ................................................................
[4]
June 2025 · Paper 2 · Q20(b)(i) 3 marks Data interpretation Easy aromatic compounds
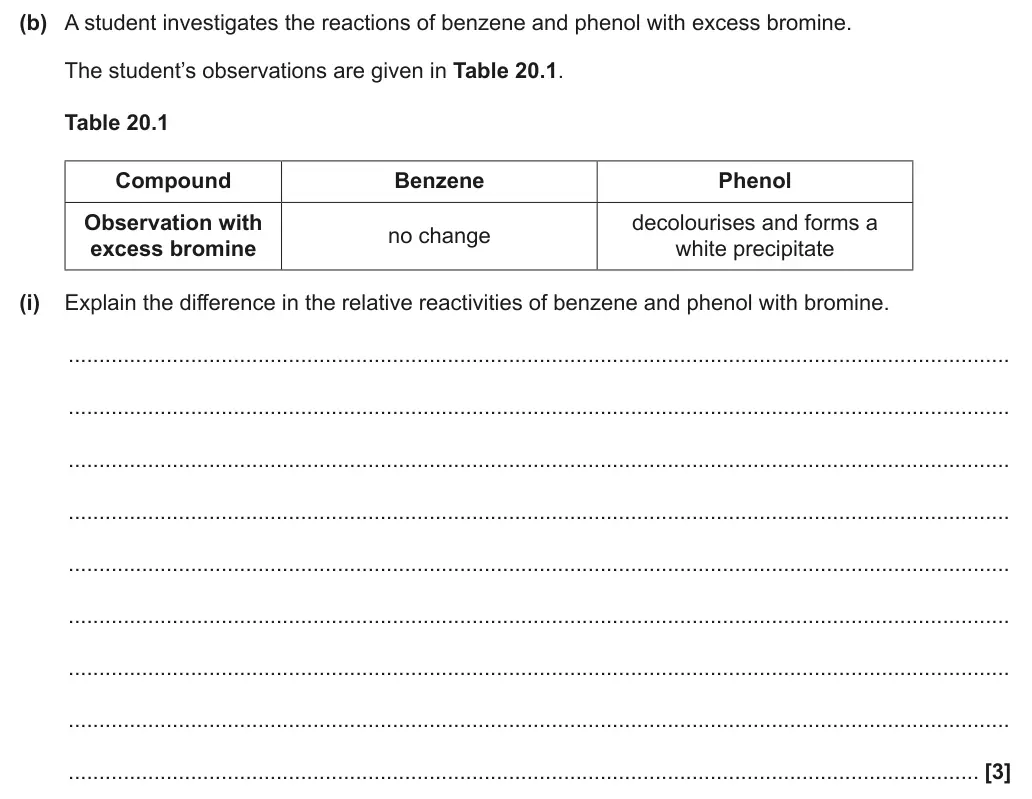
(b) A student investigates the reactions of benzene and phenol with excess bromine.
The student’s observations are given in Table 20.1.
Table 20.1
Compound Benzene Phenol
Observation with decolourises and forms a
no change
excess bromine white precipitate
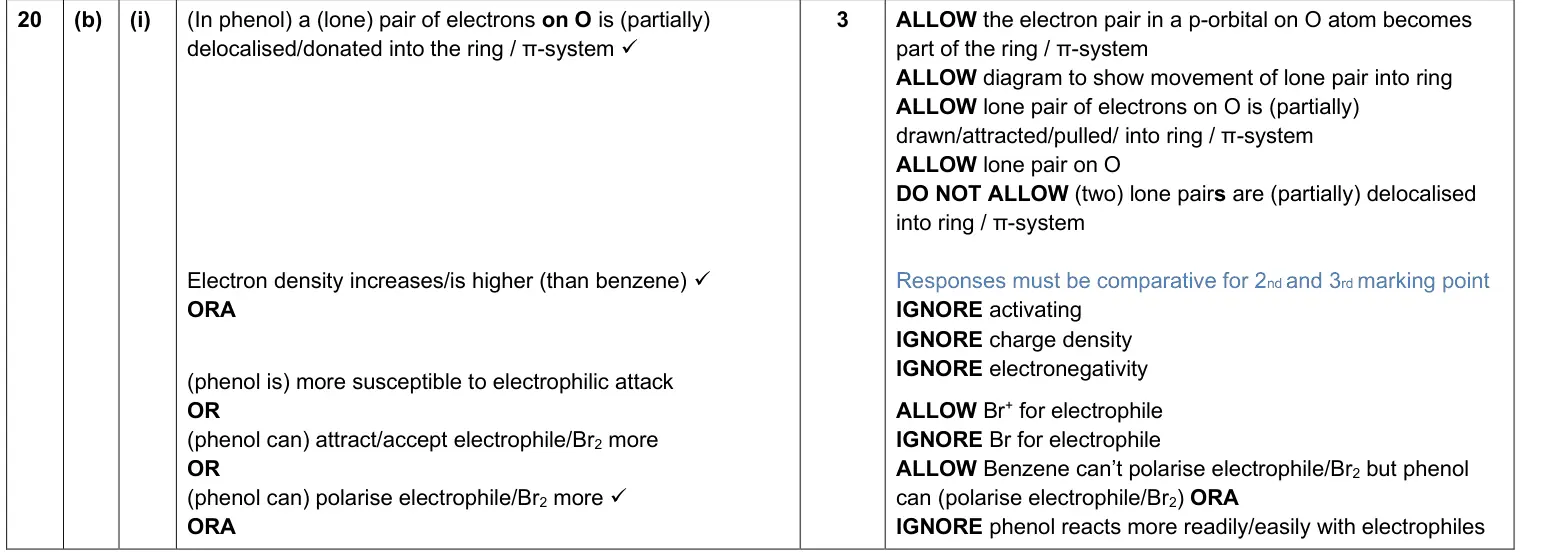
(i) Explain the difference in the relative reactivities of benzene and phenol with bromine.
..........................................................................................................................................................
..........................................................................................................................................................
..........................................................................................................................................................
..........................................................................................................................................................
..........................................................................................................................................................
..........................................................................................................................................................
..........................................................................................................................................................
..........................................................................................................................................................
..................................................................................................................................................... [3]
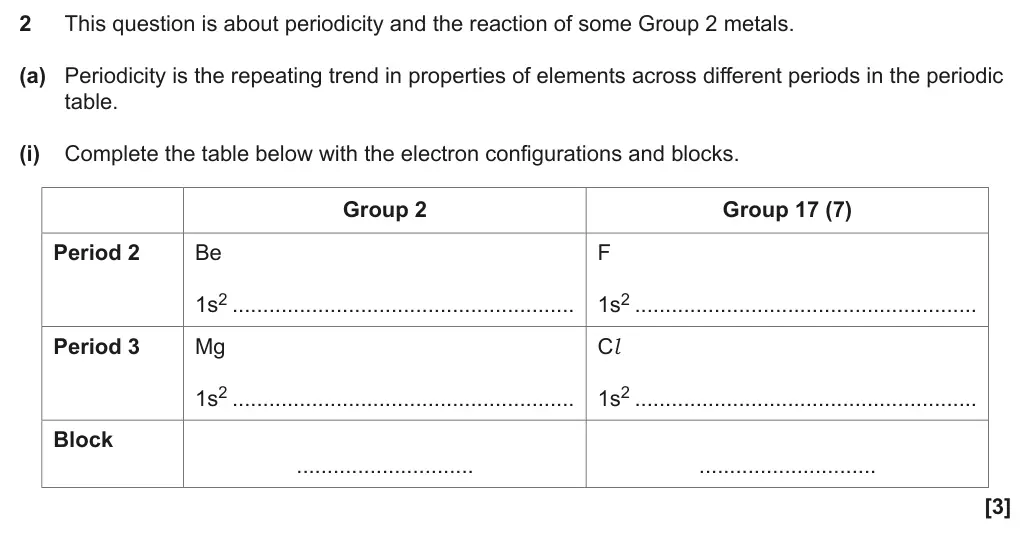
June 2024 · AS Paper 2 · Q2(a)(ii) 2 marks Data interpretation Hard periodicity
Earlier part of question 2 that this part usesEarlier part of June 2024 Paper 2 question 2
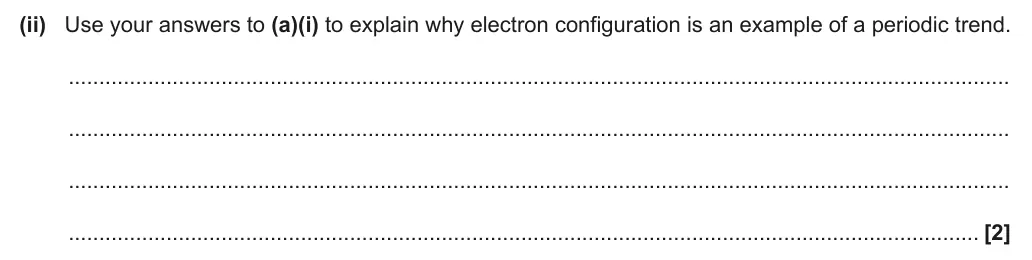
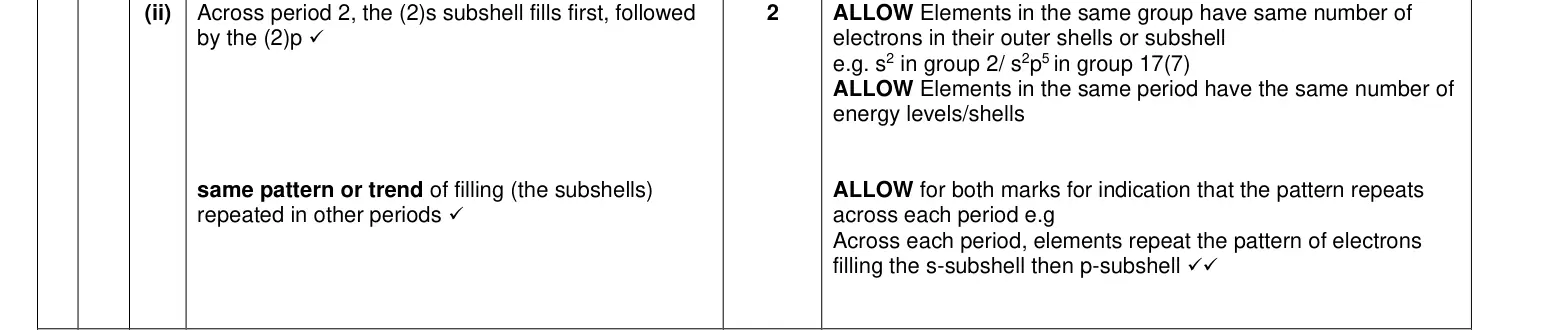
(ii) Use your answers to (a)(i) to explain why electron configuration is an example of a periodic trend.
..........................................................................................................................................................
..........................................................................................................................................................
..........................................................................................................................................................
..................................................................................................................................................... [2]
June 2024 · Paper 3 · Q5(b)(i) 2 marks Data interpretation Medium transition elements
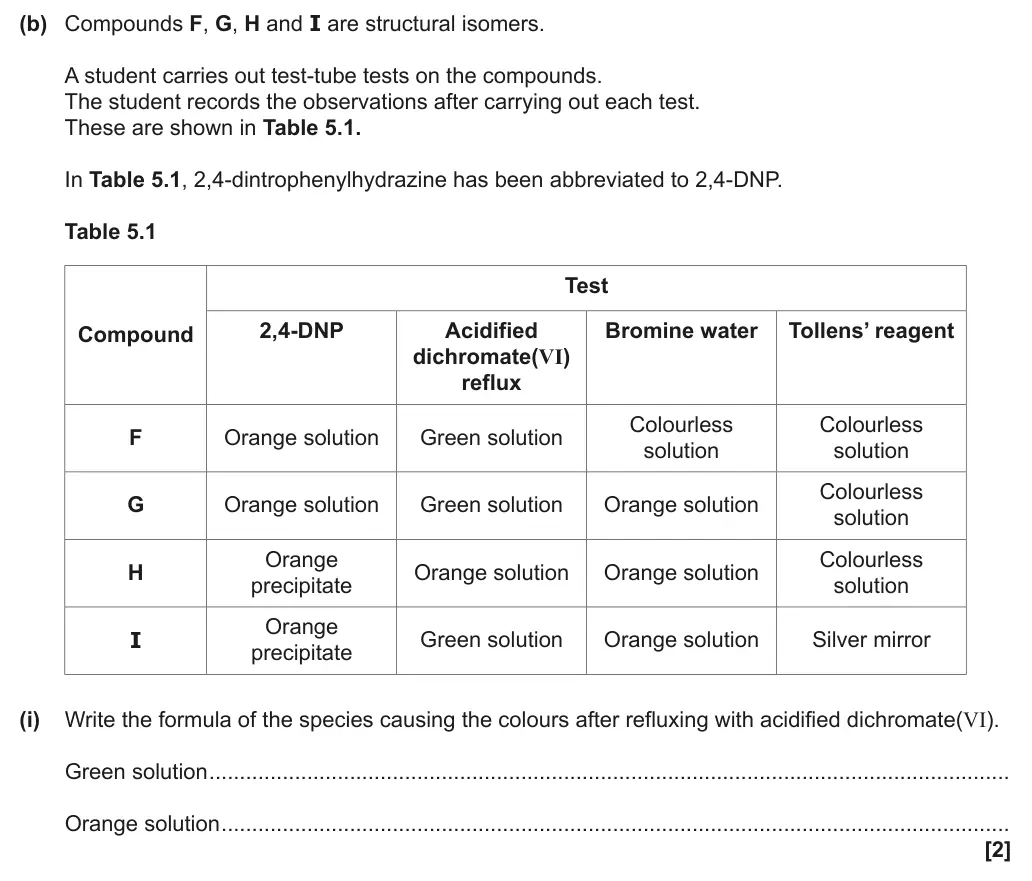
(b) Compounds F, G, H and I are structural isomers.
A student carries out test-tube tests on the compounds.
The student records the observations after carrying out each test.
These are shown in Table 5.1.
In Table 5.1, 2,4-dintrophenylhydrazine has been abbreviated to 2,4-DNP.
Table 5.1
Test
Compound 2,4-DNP Acidified Bromine water Tollens’ reagent
dichromate(VI)
reflux
Colourless Colourless
F Orange solution Green solution
solution solution
Colourless
G Orange solution Green solution Orange solution
solution
Orange Colourless
H Orange solution Orange solution
precipitate solution
Orange
I Green solution Orange solution Silver mirror
precipitate
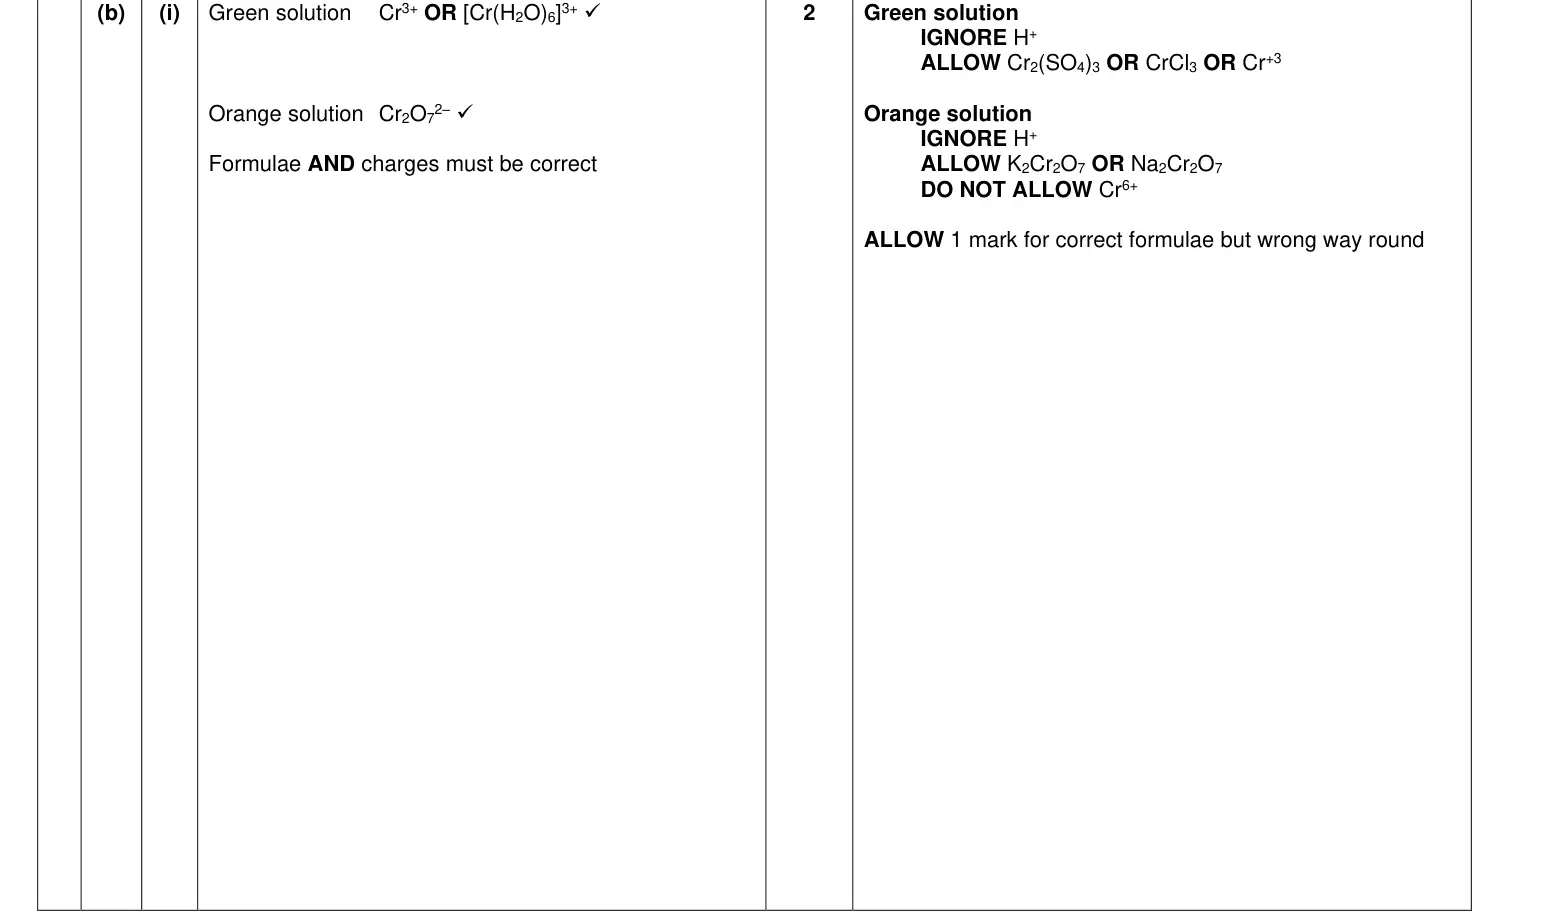
(i) Write the formula of the species causing the colours after refluxing with acidified dichromate(VI).
Green solution ...................................................................................................................................
Orange solution .................................................................................................................................
[2]
June 2023 · AS Paper 1 · Q23(a)(iii) 2 marks AO1 Data interpretation Easy reaction rates
Earlier part of question 23 that this part usesEarlier part of June 2023 Paper 1 question 23
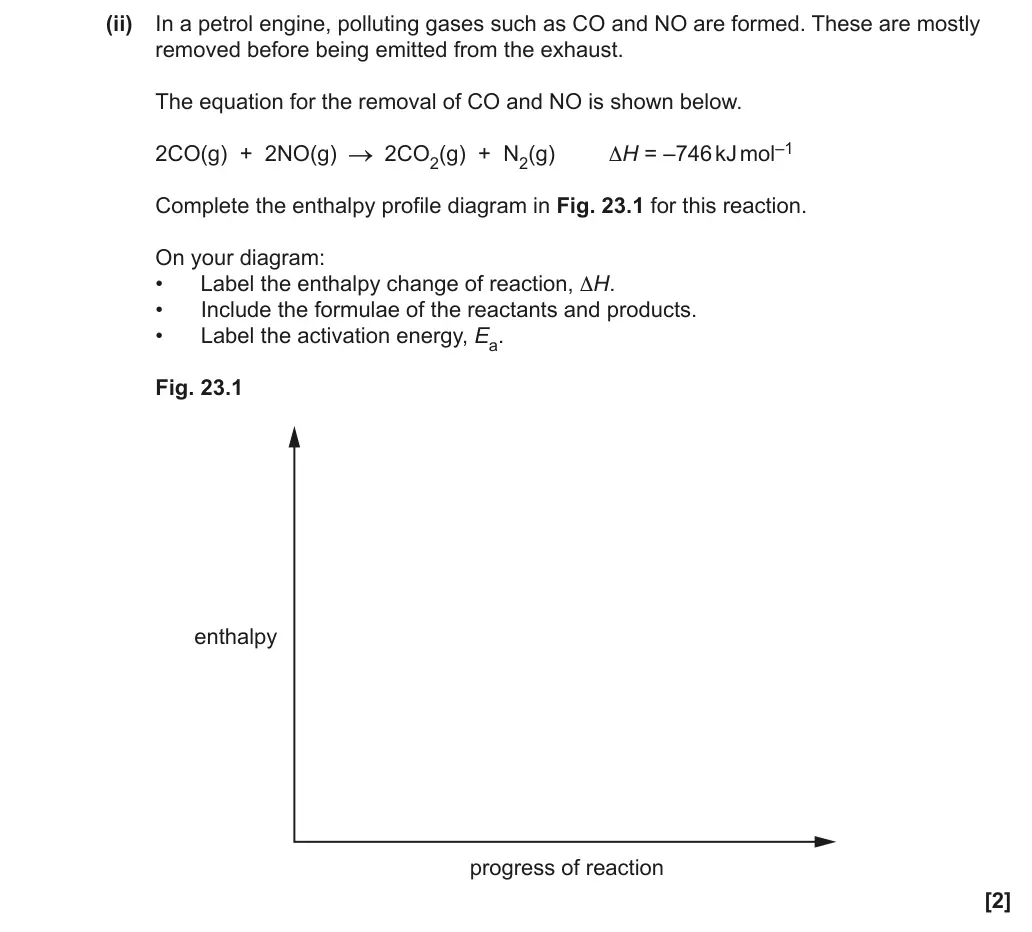
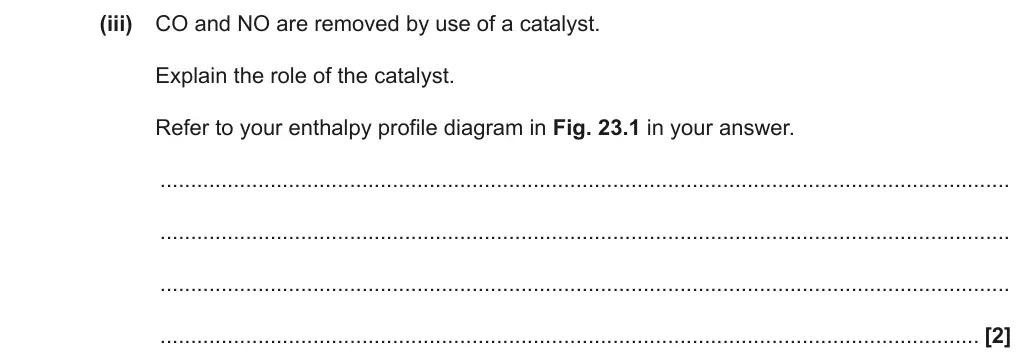
(iii) CO and NO are removed by use of a catalyst.
Explain the role of the catalyst.
Refer to your enthalpy profile diagram in Fig. 23.1 in your answer.
...........................................................................................................................................
...........................................................................................................................................
...........................................................................................................................................
...................................................................................................................................... [2]
June 2023 · AS Paper 2 · Q3(b) 3 marks AO1, 2 Data interpretation Hard halogensredox
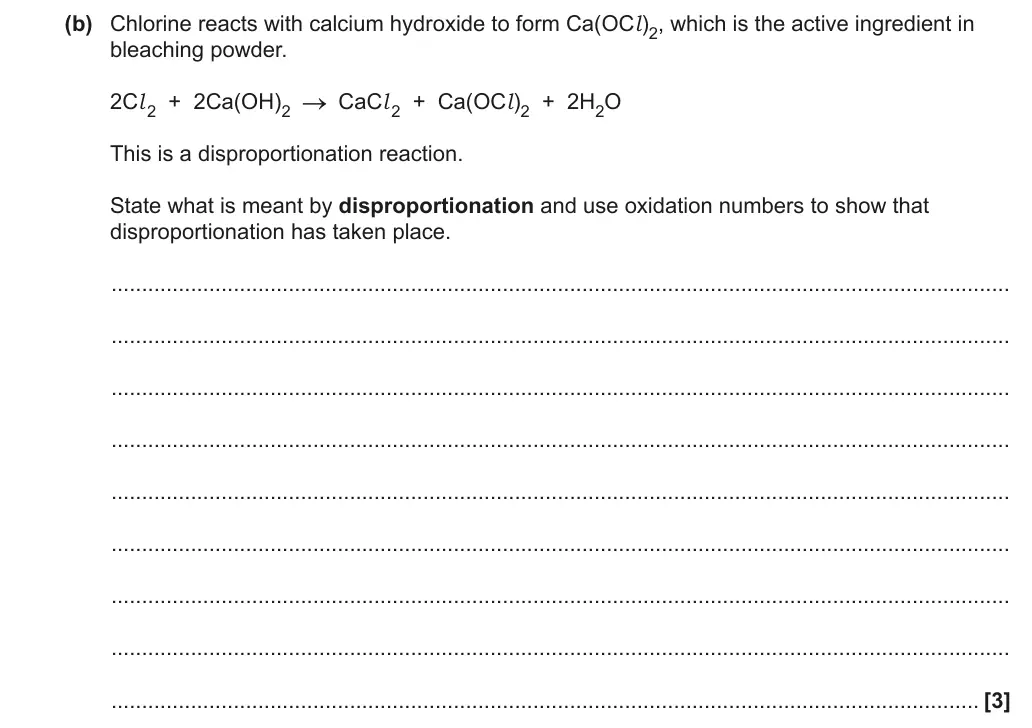
(b) Chlorine reacts with calcium hydroxide to form Ca(OCl )2, which is the active ingredient in
bleaching powder.
2Cl 2  +  2Ca(OH)2 CaCl 2  +  Ca(OCl )2  +  2H2O
This is a disproportionation reaction.
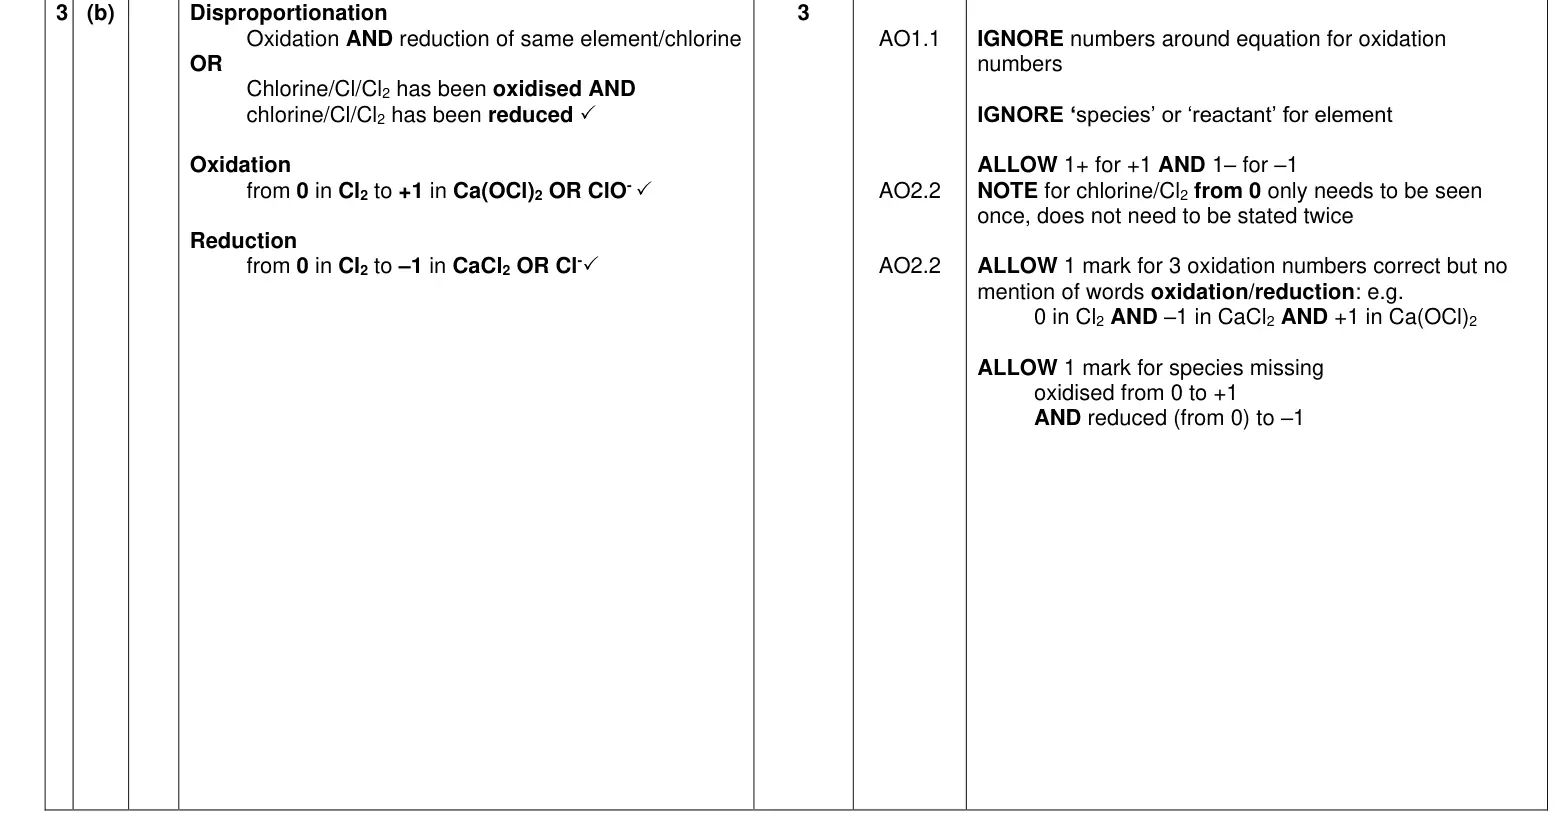
State what is meant by disproportionation and use oxidation numbers to show that
disproportionation has taken place.
...................................................................................................................................................
...................................................................................................................................................
...................................................................................................................................................
...................................................................................................................................................
...................................................................................................................................................
...................................................................................................................................................
...................................................................................................................................................
...................................................................................................................................................
.............................................................................................................................................. [3]
June 2023 · AS Paper 2 · Q5(a)(iii) 2 marks AO3 Data interpretation Hard alkenes
Earlier parts of question 5 that this part usesEarlier part of June 2023 Paper 2 question 5Earlier part of June 2023 Paper 2 question 5
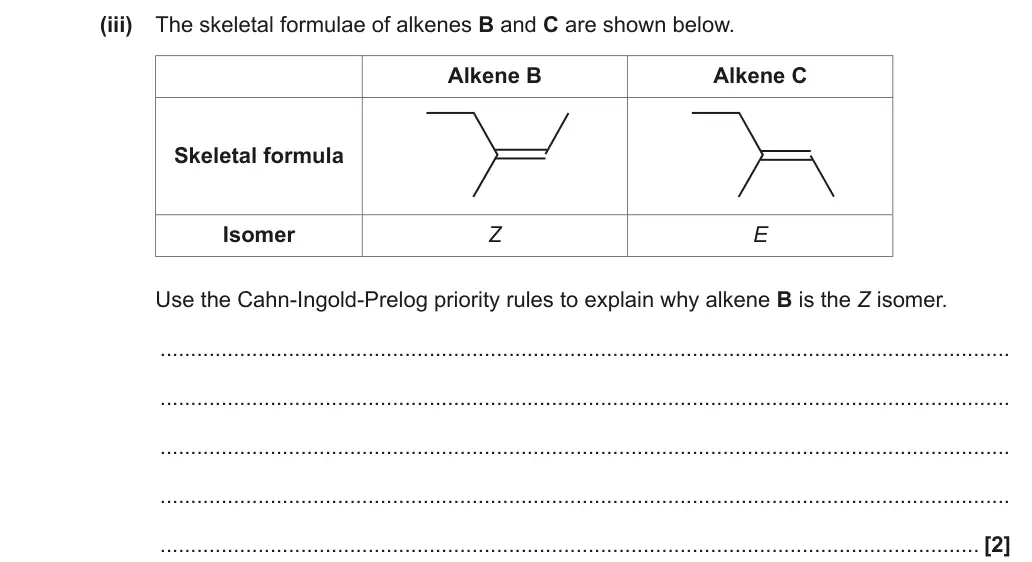
(iii) The skeletal formulae of alkenes B and C are shown below.
Alkene B Alkene C
Skeletal formula
Isomer Z E
Use the Cahn-Ingold-Prelog priority rules to explain why alkene B is the Z isomer.
...........................................................................................................................................
...........................................................................................................................................
...........................................................................................................................................
...........................................................................................................................................
...................................................................................................................................... [2]
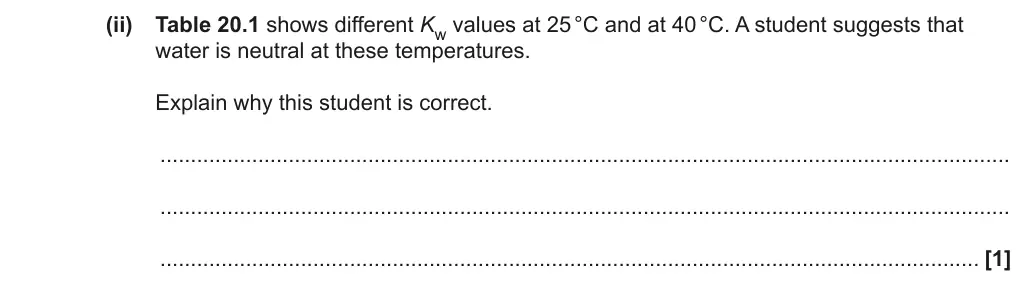
June 2023 · Paper 1 · Q20(a)(ii) 1 mark AO3 Data interpretation Hard acids bases and buffers
Earlier part of question 20 that this part usesEarlier part of June 2023 Paper 1 question 20
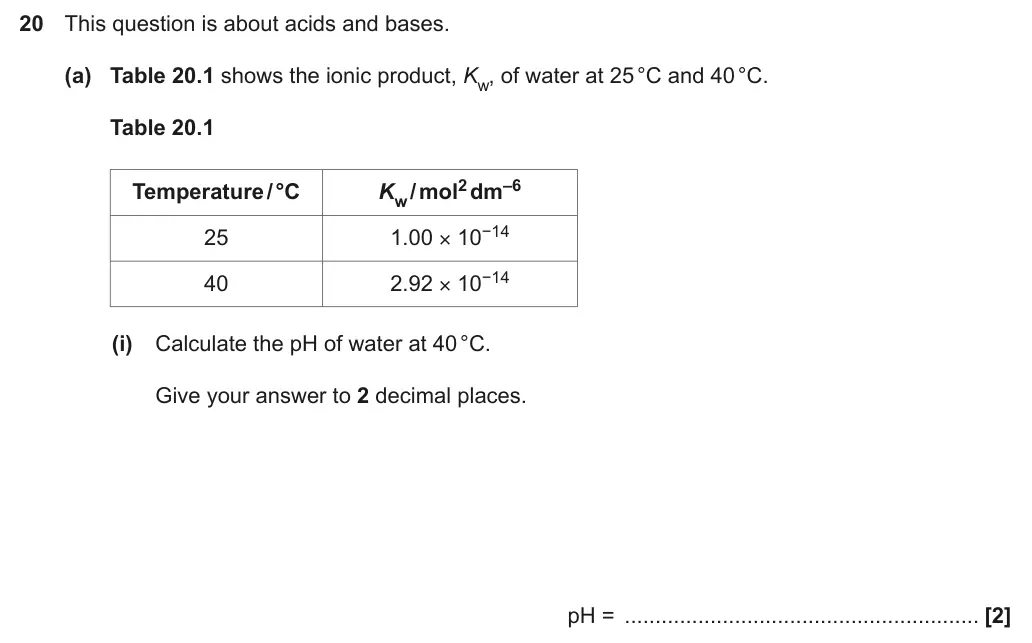
(ii) Table 20.1 shows different Kw values at 25 °C and at 40 °C. A student suggests that
water is neutral at these temperatures.
Explain why this student is correct.
...........................................................................................................................................
...........................................................................................................................................
...................................................................................................................................... [1]
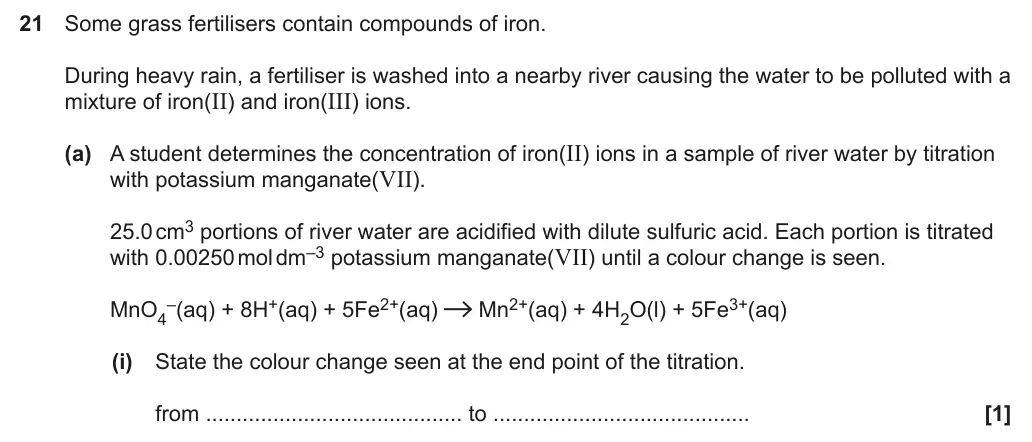
June 2023 · Paper 1 · Q21(b) 4 marks AO3 Data interpretation Medium redox and electrode potentialspractical skills
Earlier part of question 21 that this part usesEarlier part of June 2023 Paper 1 question 21
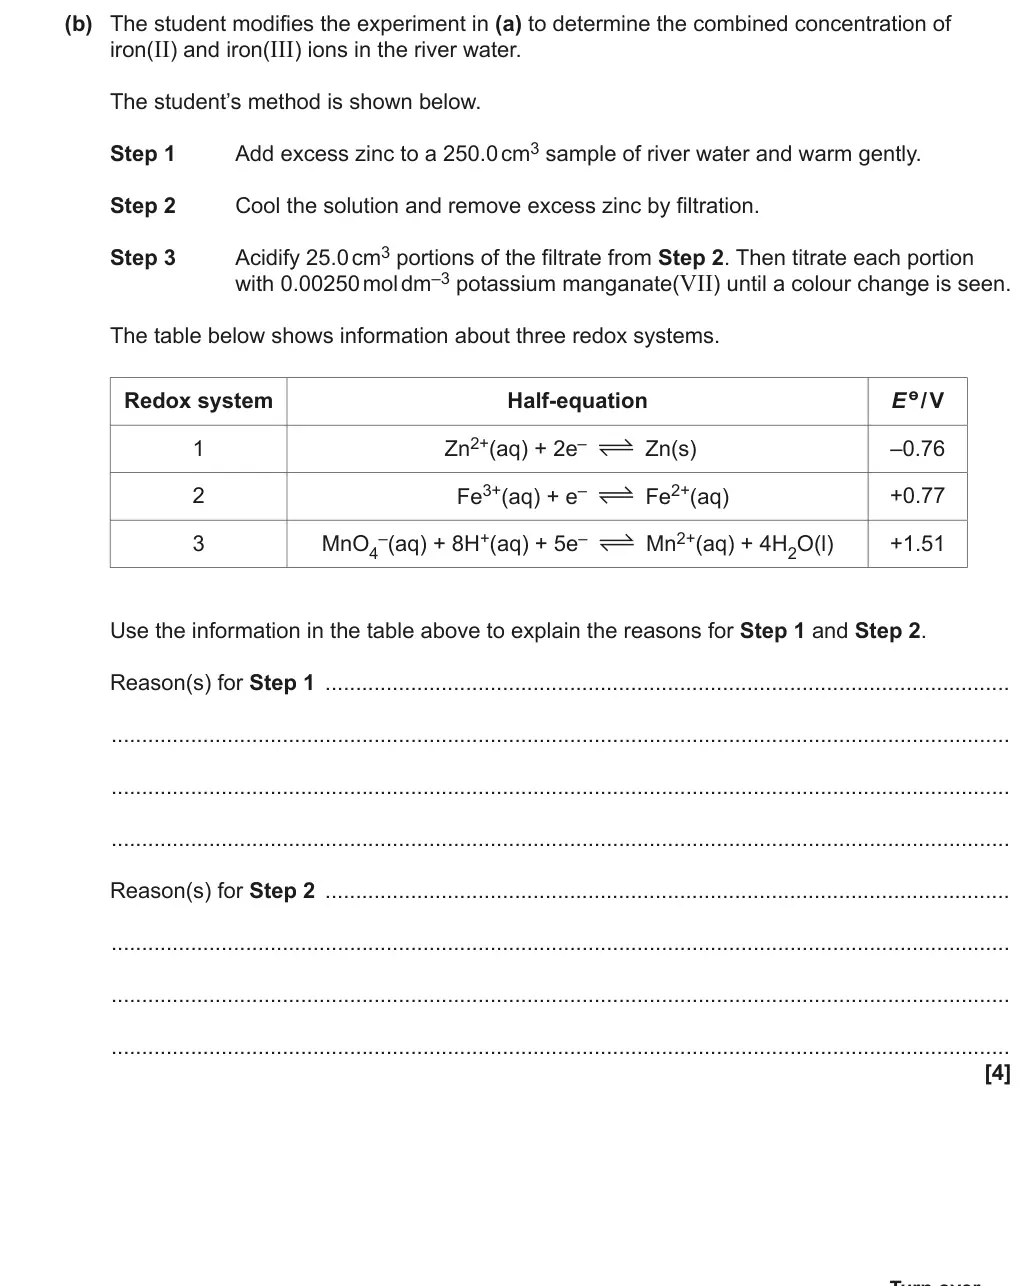
(b) The student modifies the experiment in (a) to determine the combined concentration of
iron(II) and iron(III) ions in the river water.
The student’s method is shown below.
Step 1 Add excess zinc to a 250.0 cm3 sample of river water and warm gently.
Step 2 Cool the solution and remove excess zinc by filtration.
Step 3 Acidify 25.0 cm3 portions of the filtrate from Step 2. Then titrate each portion
with 0.00250 mol dm–3 potassium manganate(VII) until a colour change is seen.
The table below shows information about three redox systems.
Redox system Half-equation E ө / V
1 Zn2+(aq) + 2e– Zn(s) –0.76
2 Fe3+(aq) + e– Fe2+(aq) +0.77
3 MnO4 –(aq) + 8H+(aq) + 5e– Mn2+(aq) + 4H2O(l) +1.51
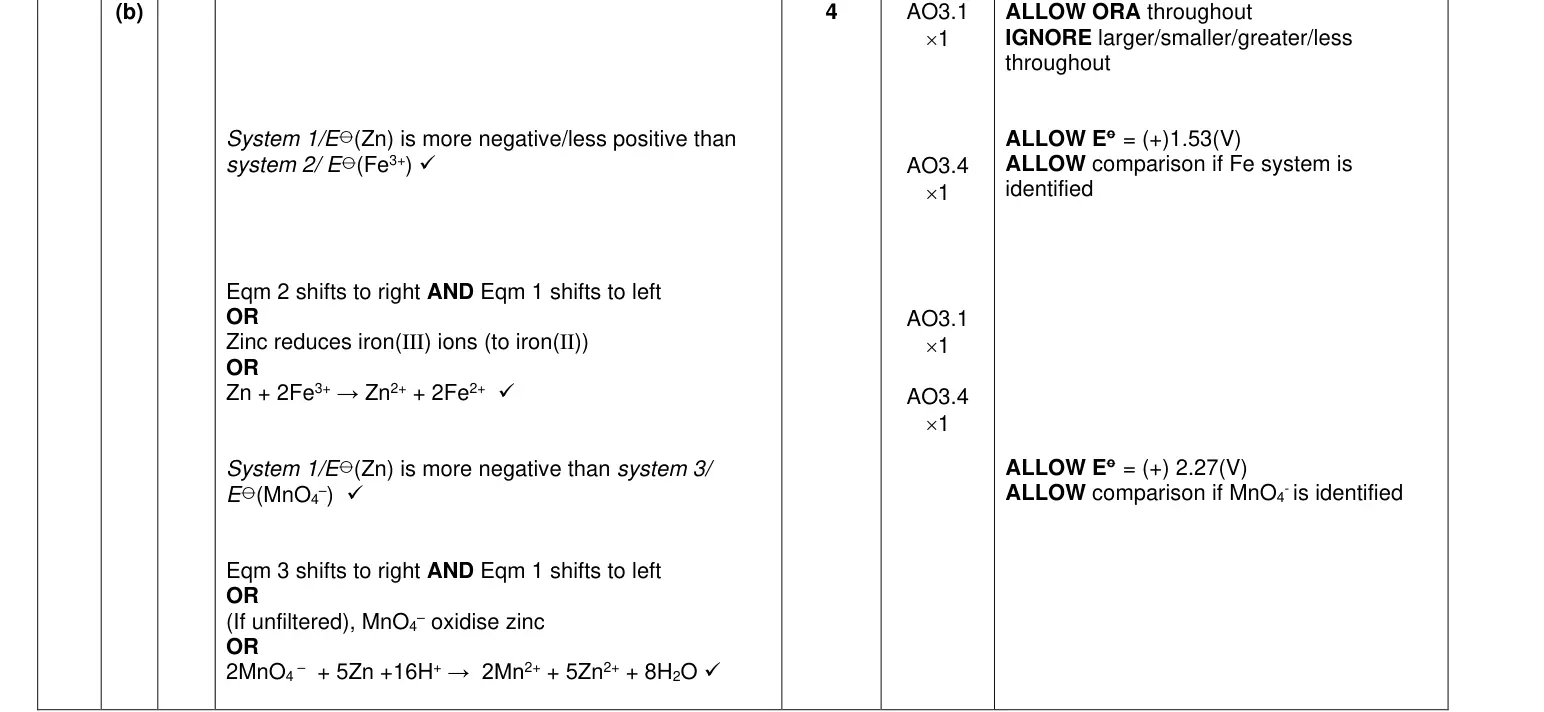
Use the information in the table above to explain the reasons for Step 1 and Step 2.
Reason(s) for Step 1  ................................................................................................................
...................................................................................................................................................
...................................................................................................................................................
...................................................................................................................................................
Reason(s) for Step 2  ................................................................................................................
...................................................................................................................................................
...................................................................................................................................................
...................................................................................................................................................
[4]
June 2022 · AS Paper 2 · Q3(a)(i) 3 marks AO1, 2 Data interpretation Hard reaction rates
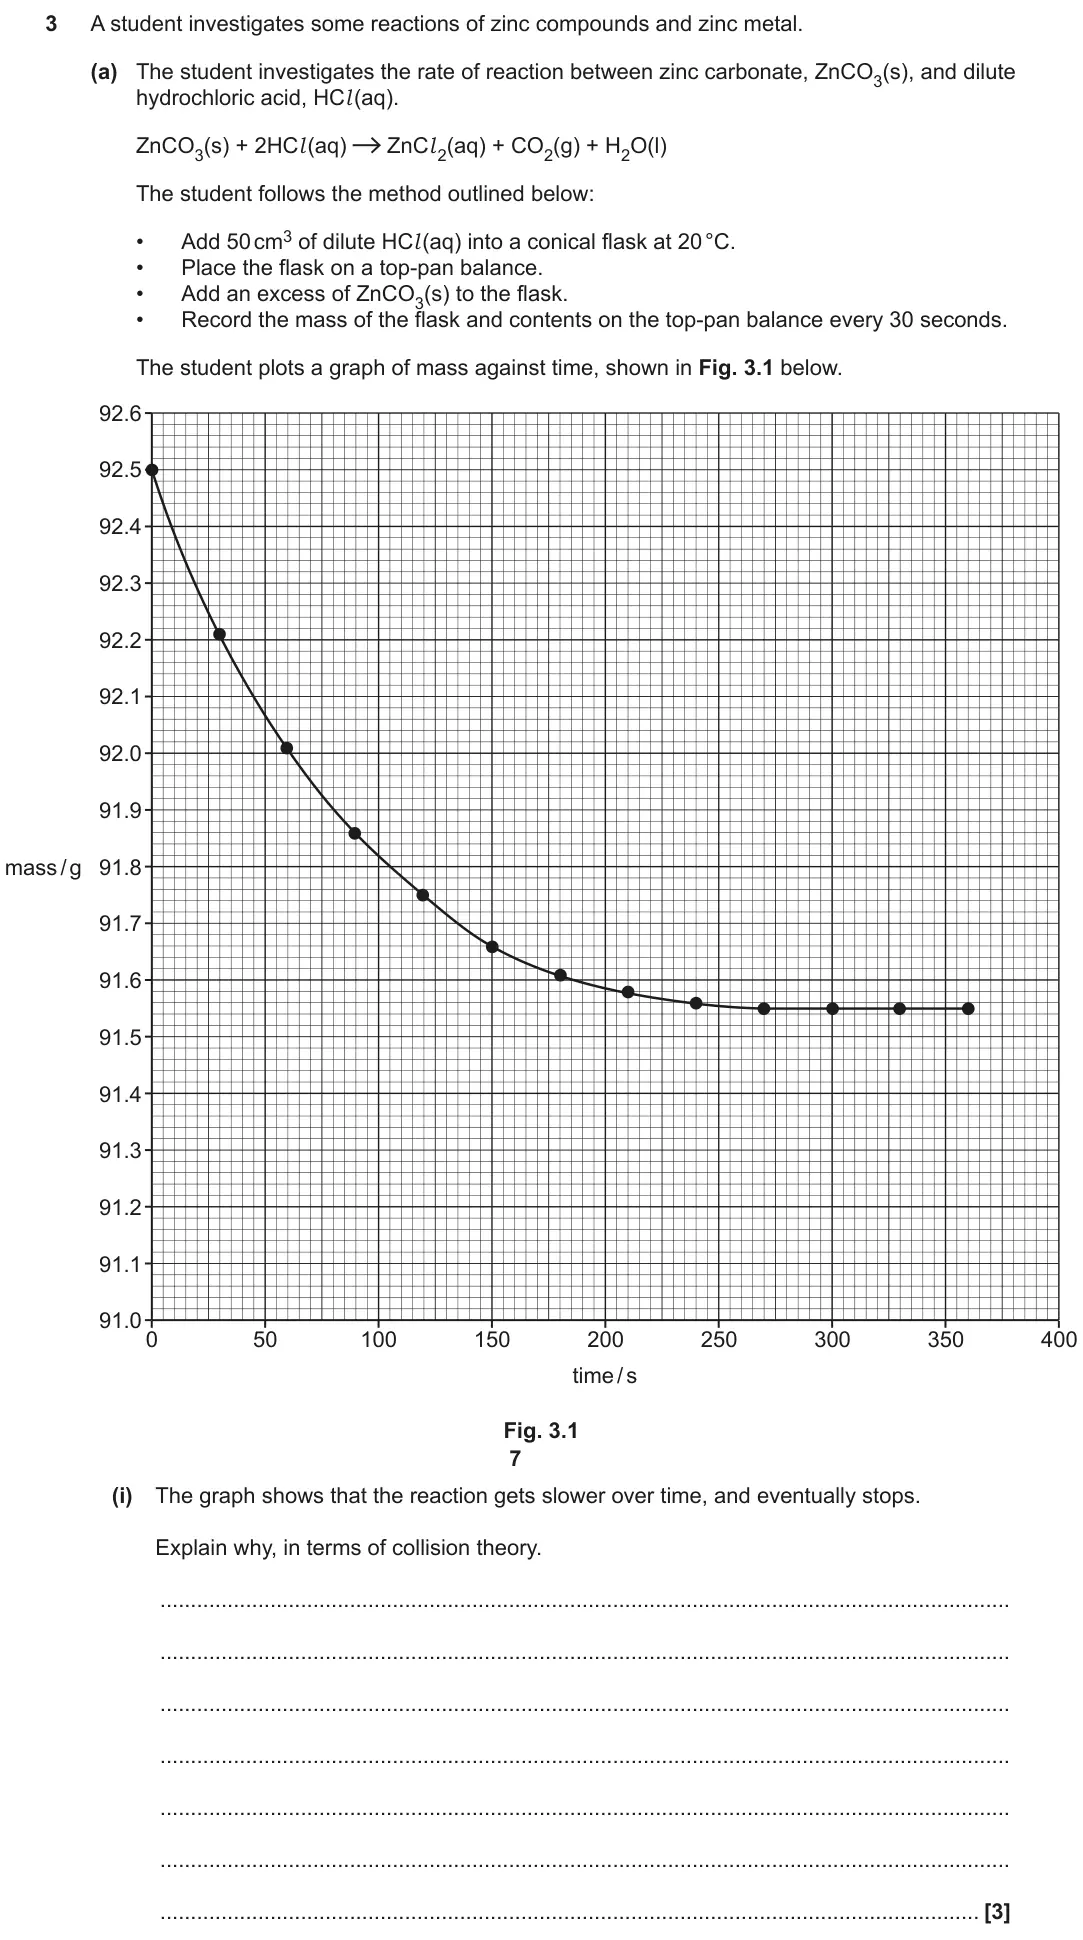
3 A student investigates some reactions of zinc compounds and zinc metal.
(a) The student investigates the rate of reaction between zinc carbonate, ZnCO3(s), and dilute
hydrochloric acid, HCl (aq).
ZnCO3(s) + 2HCl (aq) ZnCl 2(aq) + CO2(g) + H2O(l)
The student follows the method outlined below:
• Add 50 cm3 of dilute HCl (aq) into a conical flask at 20 °C.
• Place the flask on a top-pan balance.
• Add an excess of ZnCO3(s) to the flask.
• Record the mass of the flask and contents on the top-pan balance every 30 seconds.
The student plots a graph of mass against time, shown in Fig. 3.1 below.
92.6
92.5
92.4
92.3
92.2
92.1
92.0
91.9
mass / g 91.8
91.7
91.6
91.5
91.4
91.3
91.2
91.1
91.0
0 50 100 150 200 250 300 350 400
time / s
Fig. 3.1
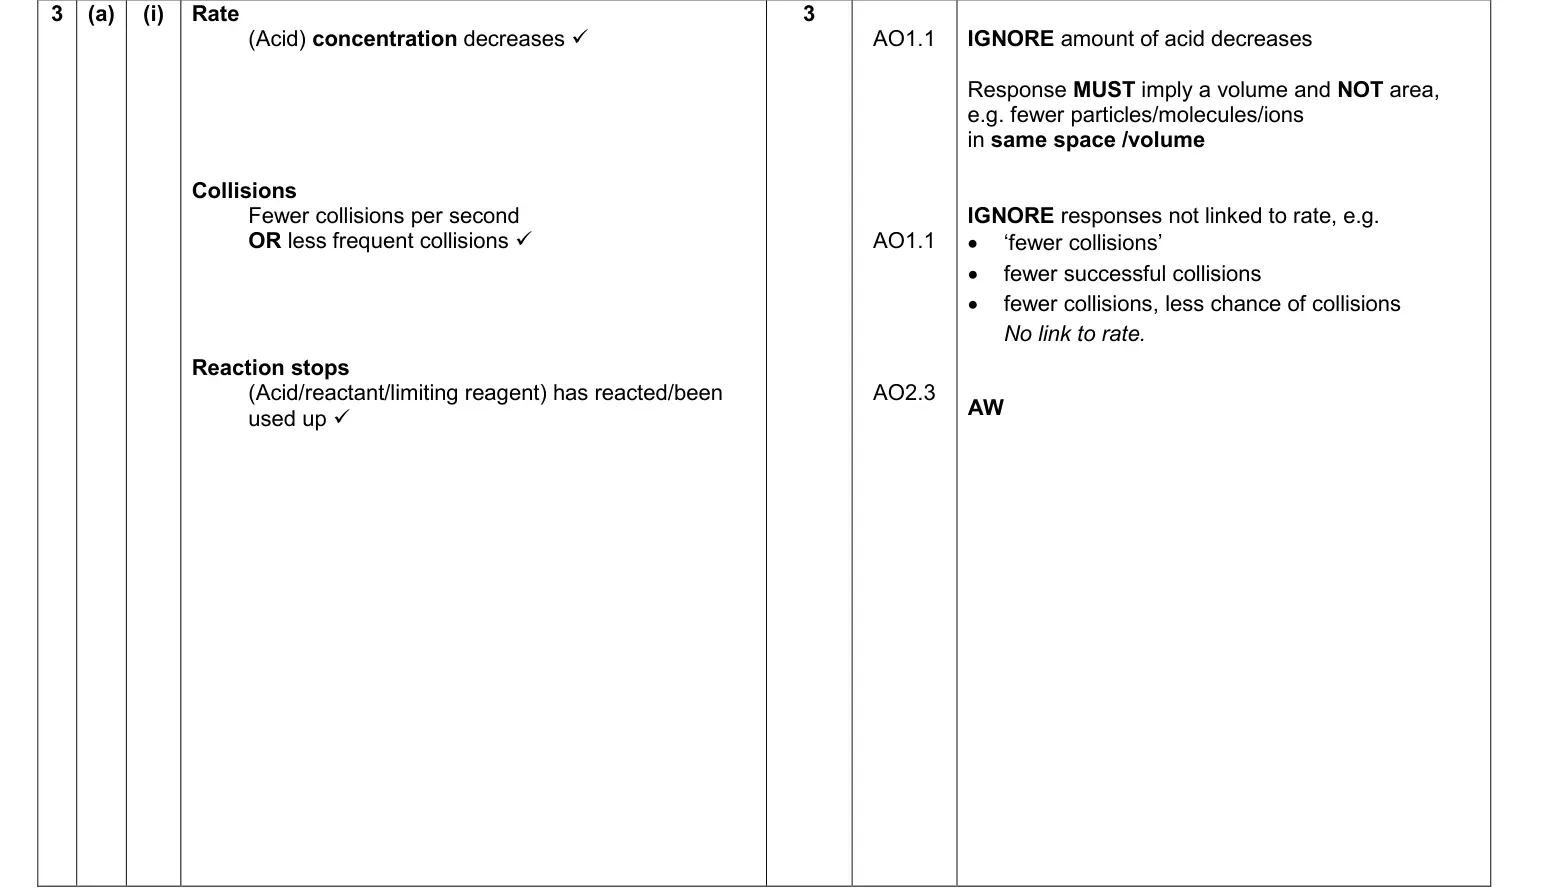
(i) The graph shows that the reaction gets slower over time, and eventually stops.
Explain why, in terms of collision theory.
...........................................................................................................................................
...........................................................................................................................................
...........................................................................................................................................
...........................................................................................................................................
...........................................................................................................................................
...........................................................................................................................................
...................................................................................................................................... [3]
June 2022 · AS Paper 2 · Q3(a)(iii) 2 marks AO3 Data interpretation Hard reaction rates
Earlier part of question 3 that this part usesEarlier part of June 2022 Paper 2 question 3
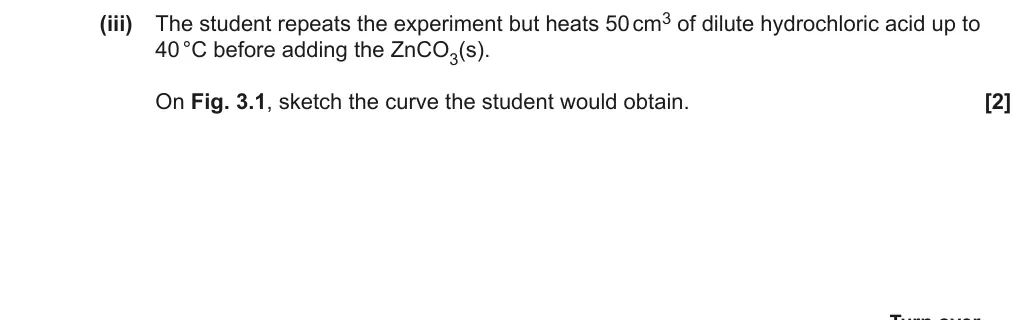
(iii) The student repeats the experiment but heats 50 cm3 of dilute hydrochloric acid up to
40 °C before adding the ZnCO3(s).
On Fig. 3.1, sketch the curve the student would obtain. [2]
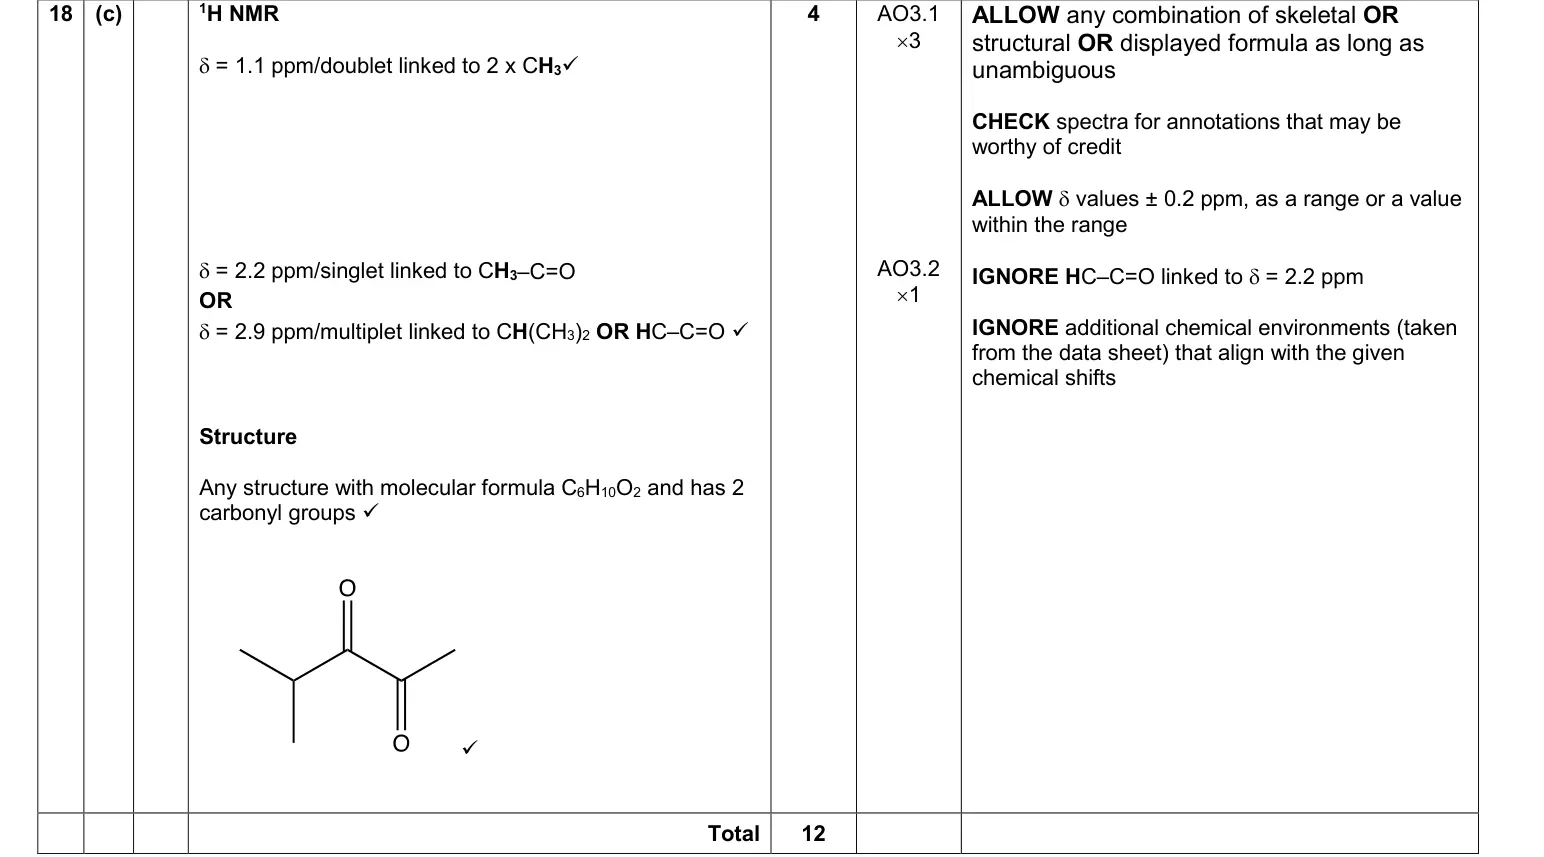
June 2022 · Paper 2 · Q18(c) 4 marks AO3 Data interpretation Hard nmr spectroscopy
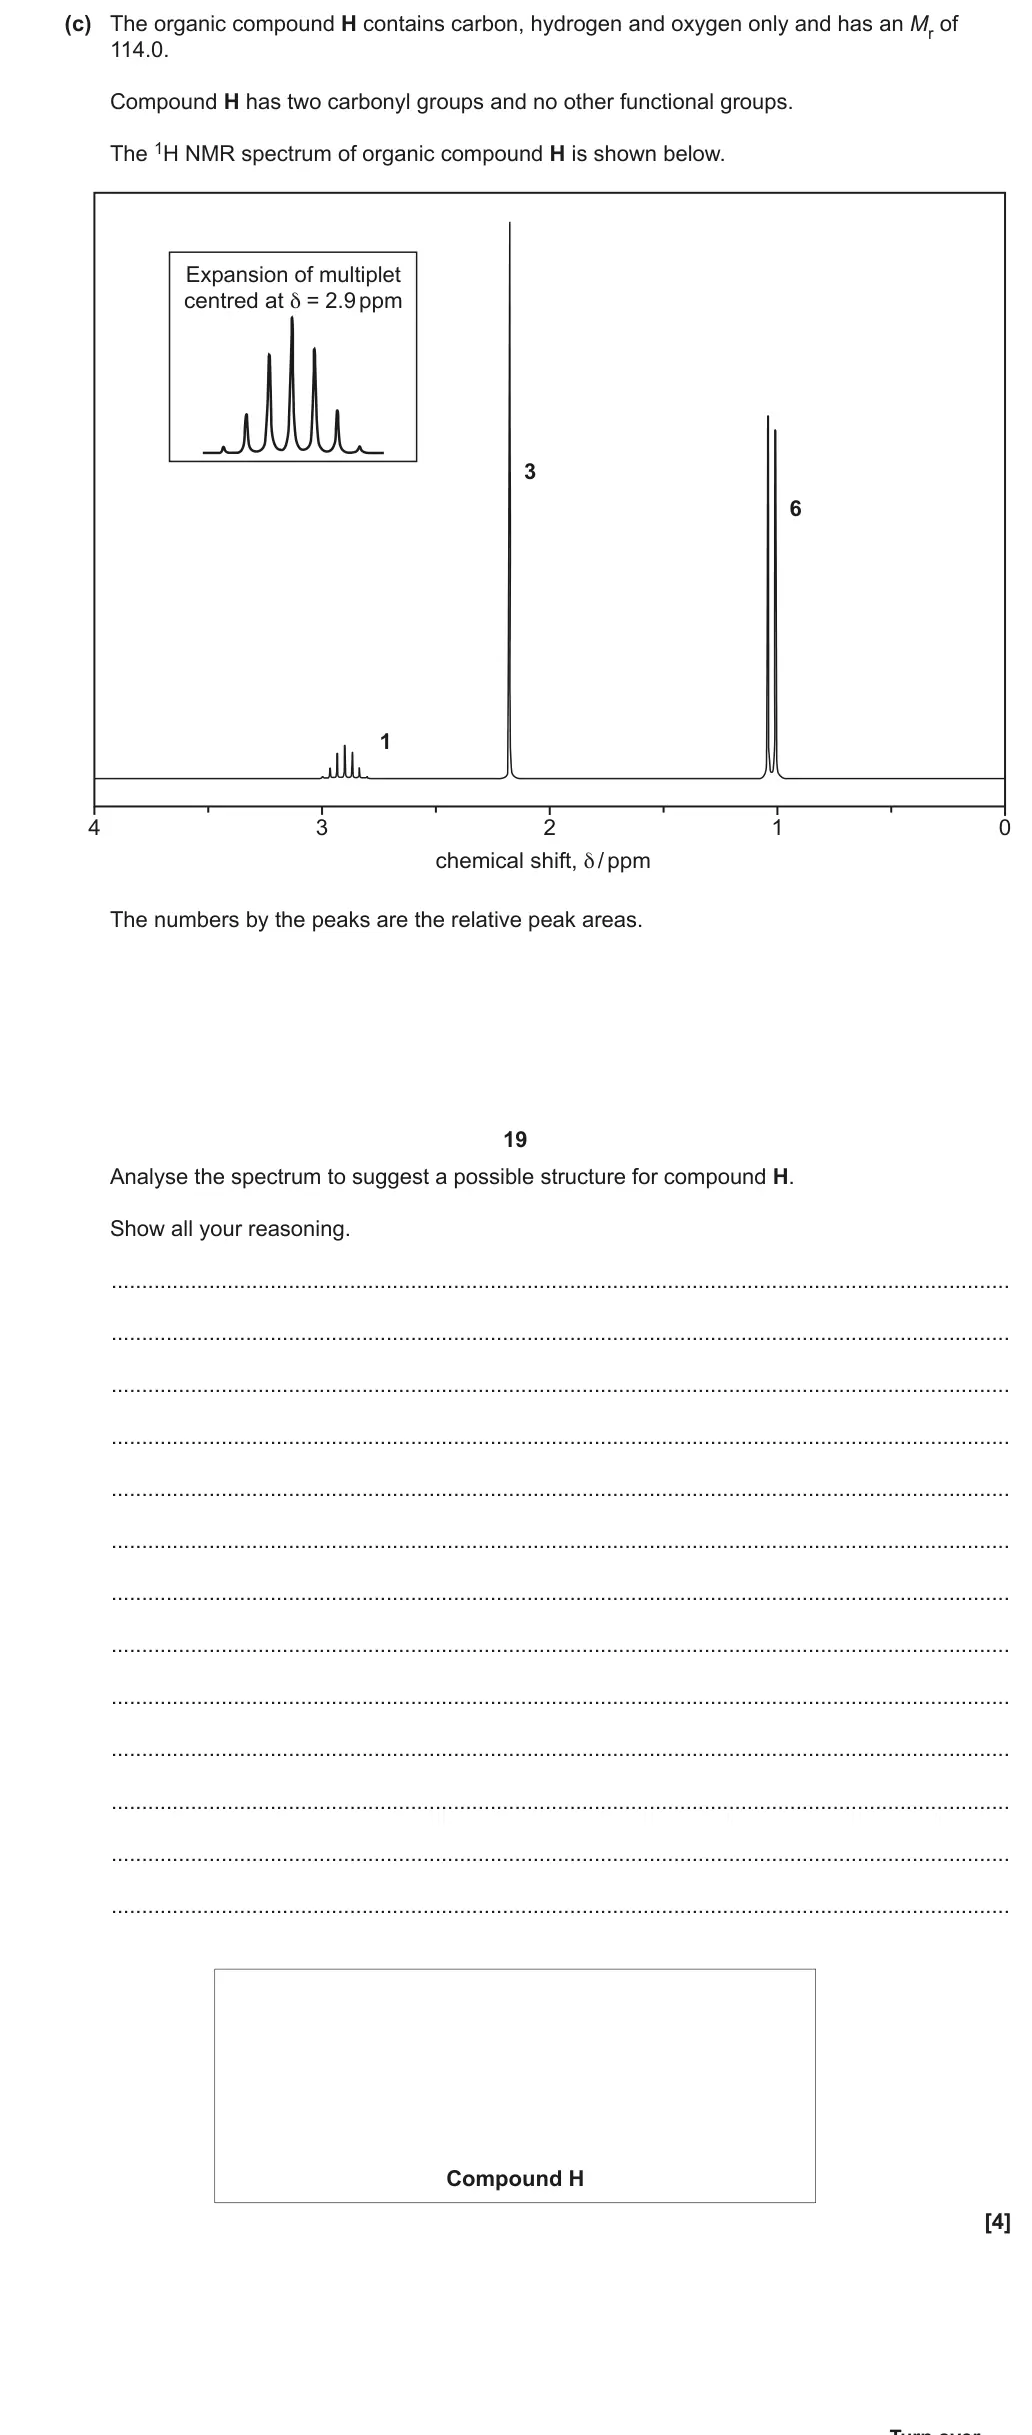
(c) The organic compound H contains carbon, hydrogen and oxygen only and has an Mr of
114.0.
Compound H has two carbonyl groups and no other functional groups.
The 1H NMR spectrum of organic compound H is shown below.
Expansion of multiplet
centred at δ = 2.9 ppm
3
6
1
4 3 2 1 0
chemical shift, δ / ppm
The numbers by the peaks are the relative peak areas.
Analyse the spectrum to suggest a possible structure for compound H.
Show all your reasoning.
...................................................................................................................................................
...................................................................................................................................................
...................................................................................................................................................
...................................................................................................................................................
...................................................................................................................................................
...................................................................................................................................................
...................................................................................................................................................
...................................................................................................................................................
...................................................................................................................................................
...................................................................................................................................................
...................................................................................................................................................
...................................................................................................................................................
...................................................................................................................................................
Compound H
[4]
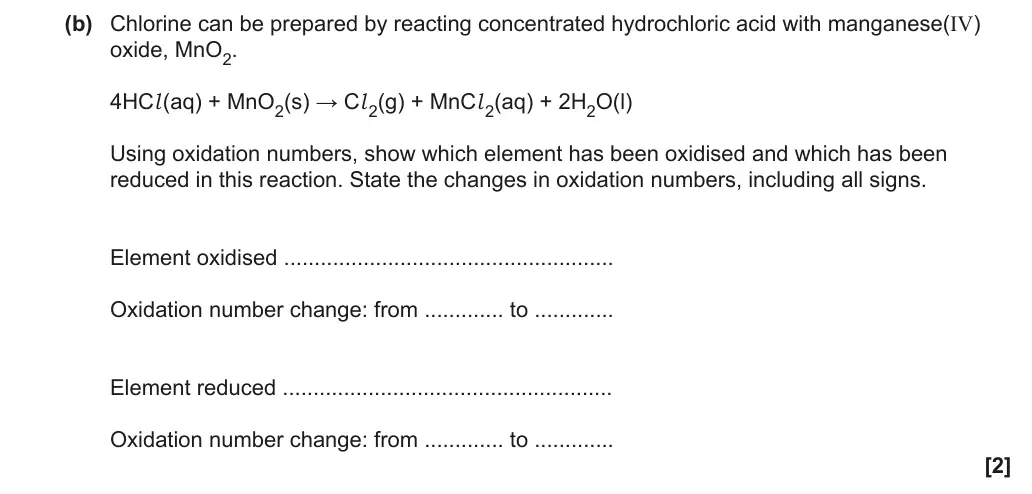
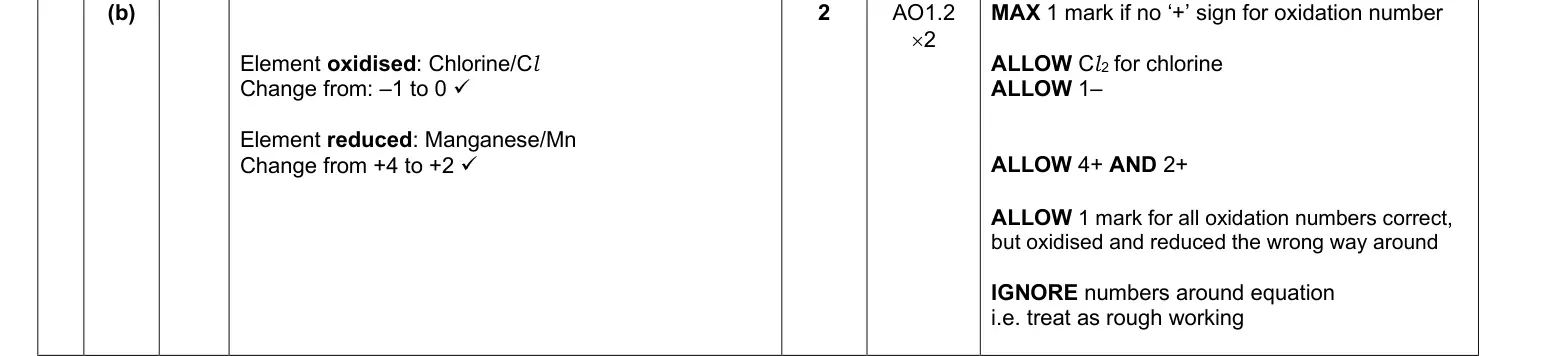
November 2021 · AS Paper 1 · Q23(b) 2 marks AO1 Data interpretation redox
(b) Chlorine can be prepared by reacting concentrated hydrochloric acid with manganese(IV)
oxide, MnO2.
4HCl (aq) + MnO2(s) → Cl 2(g) + MnCl 2(aq) + 2H2O(l)
Using oxidation numbers, show which element has been oxidised and which has been
reduced in this reaction. State the changes in oxidation numbers, including all signs.
Element oxidised ......................................................
Oxidation number change: from ............. to .............
Element reduced ......................................................
Oxidation number change: from ............. to .............
[2]
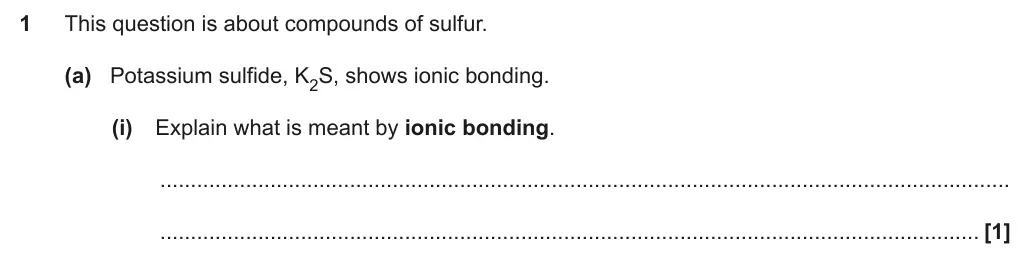
November 2021 · AS Paper 2 · Q1(c) 3 marks AO1 Data interpretation bonding and structure
Earlier parts of question 1 that this part usesEarlier part of November 2021 Paper 2 question 1Earlier part of November 2021 Paper 2 question 1
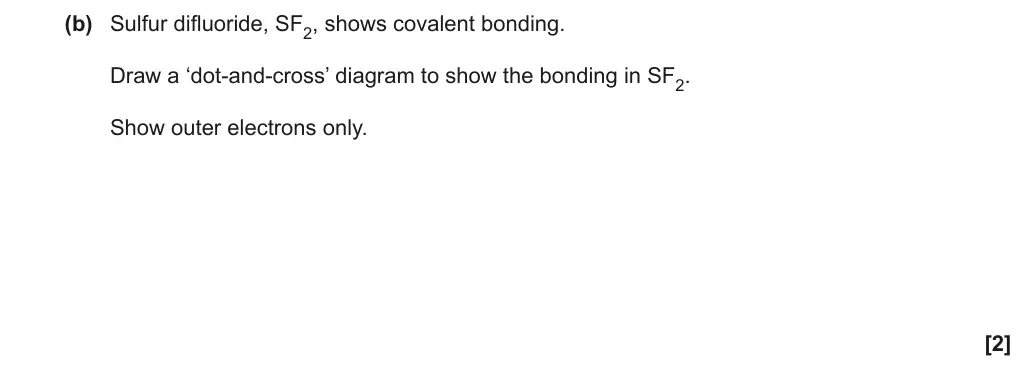
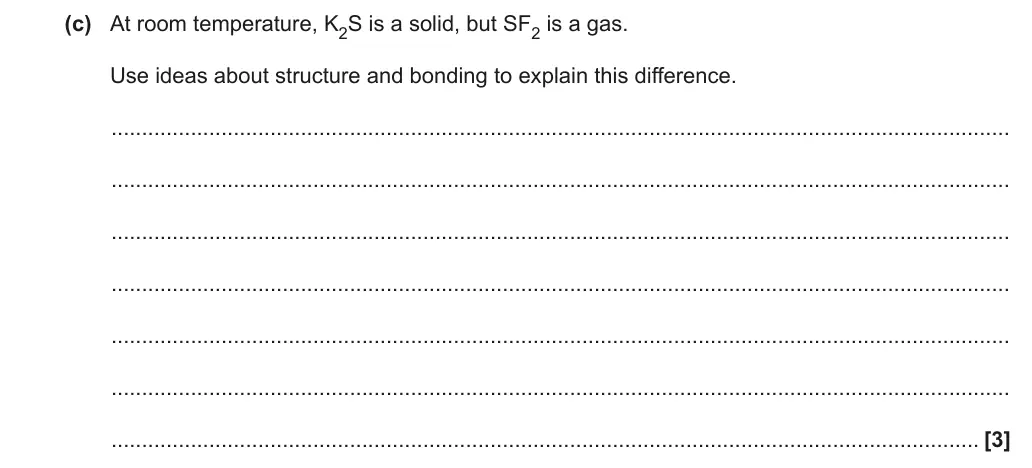
(c) At room temperature, K2S is a solid, but SF2 is a gas.
Use ideas about structure and bonding to explain this difference.
...................................................................................................................................................
...................................................................................................................................................
...................................................................................................................................................
...................................................................................................................................................
...................................................................................................................................................
...................................................................................................................................................
.............................................................................................................................................. [3]
November 2021 · AS Paper 2 · Q6(c)(ii) 2 marks AO3 Data interpretation group 2reaction rates
Earlier parts of question 6 that this part usesEarlier part of November 2021 Paper 2 question 6Earlier part of November 2021 Paper 2 question 6
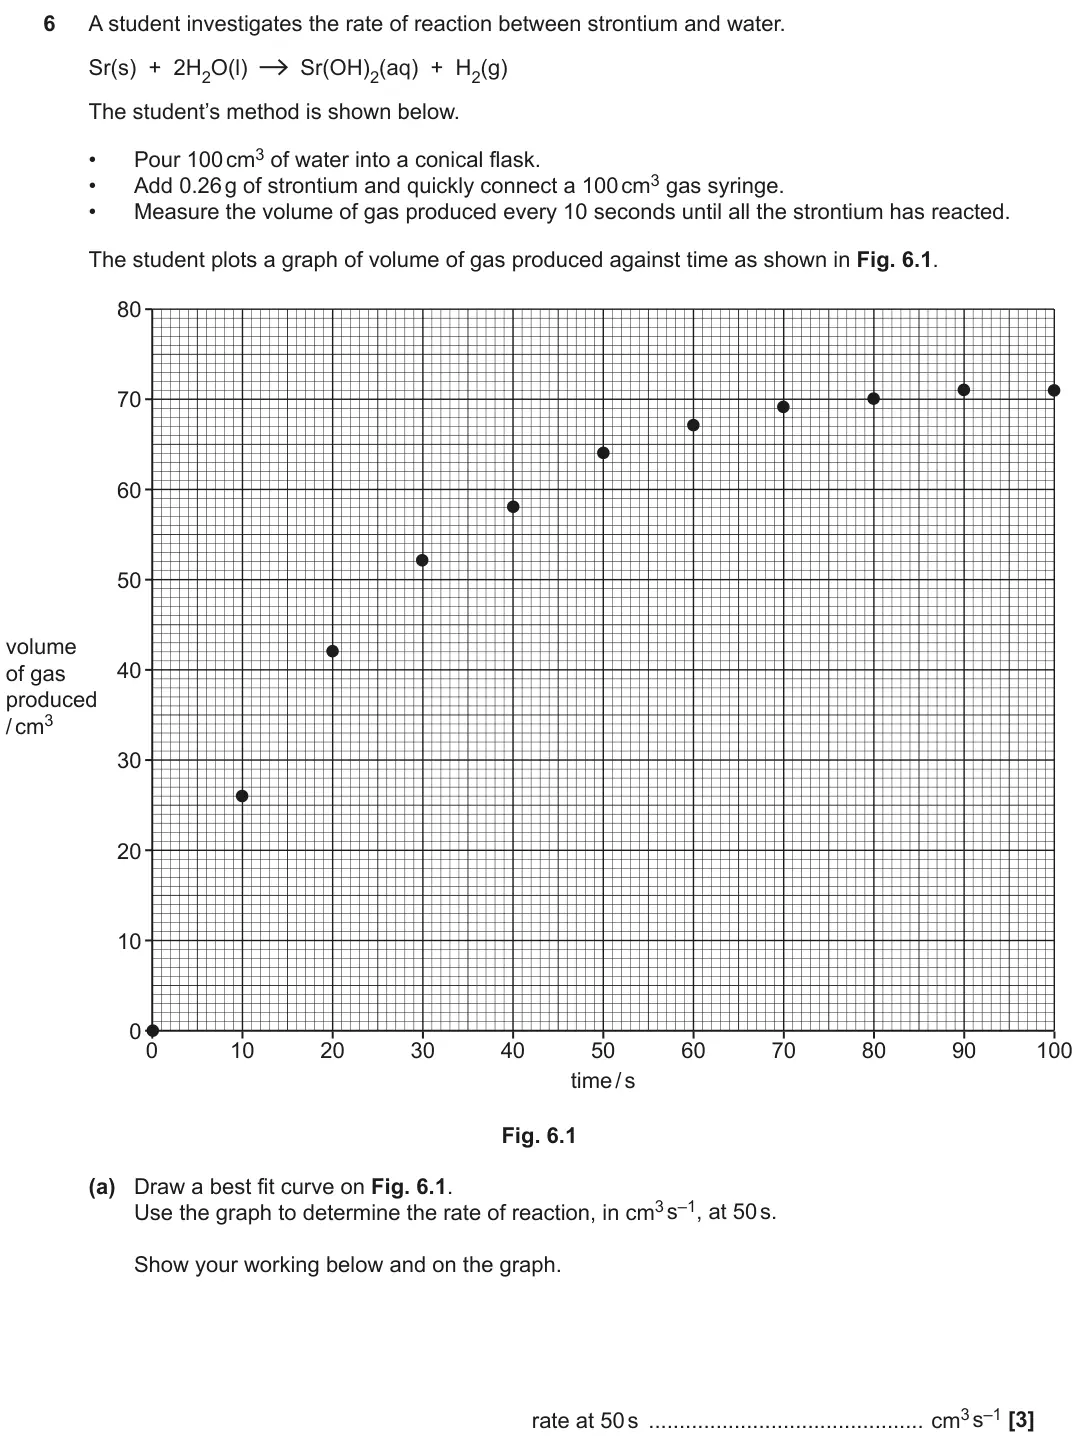
(ii) The student observes that the rate of reaction for barium is different from the rate of
reaction with strontium.
On Fig. 6.1 sketch the graph the student would obtain using barium instead of strontium.
[2]
November 2021 · Paper 1 · Q19(b)(ii) 2 marks AO3 Data interpretation Hard redox and electrode potentials
Earlier parts of question 19 that this part usesEarlier part of November 2021 Paper 1 question 19Earlier part of November 2021 Paper 1 question 19
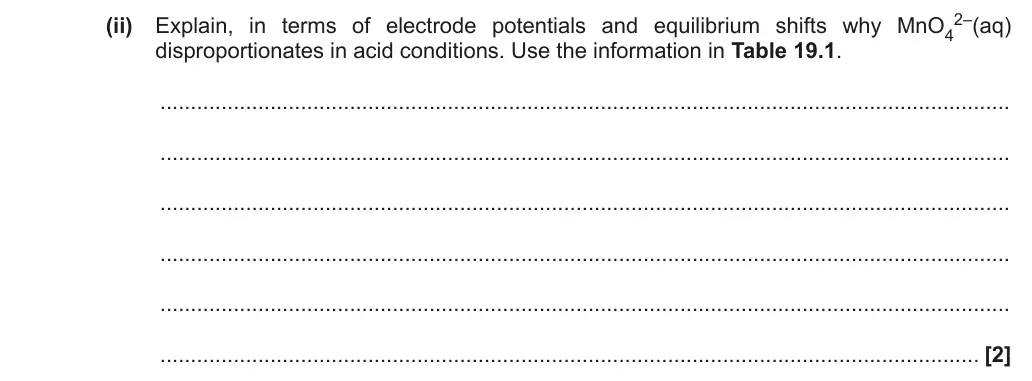
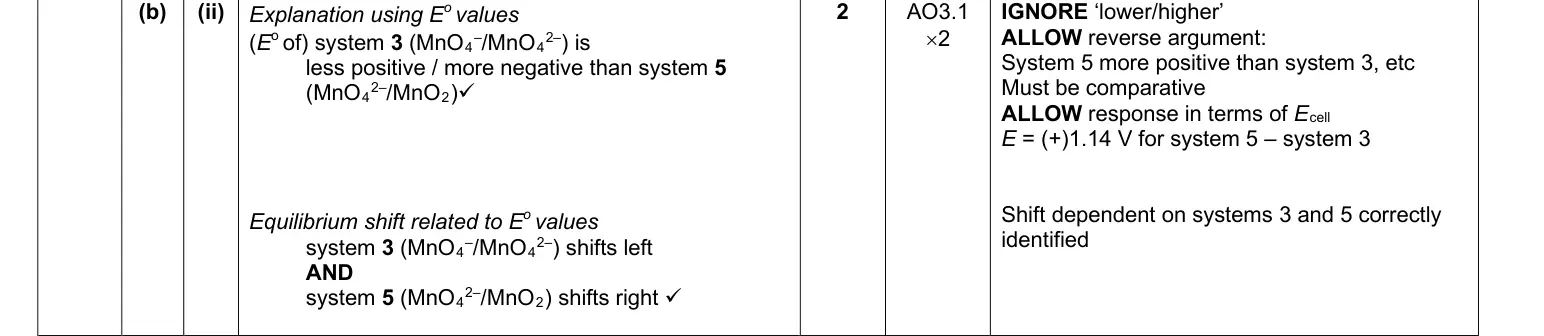
(ii) Explain, in terms of electrode potentials and equilibrium shifts why MnO4 2–(aq)
disproportionates in acid conditions. Use the information in Table 19.1.
...........................................................................................................................................
...........................................................................................................................................
...........................................................................................................................................
...........................................................................................................................................
...........................................................................................................................................
...................................................................................................................................... [2]
November 2021 · Paper 2 · Q18(a)(i) 1 mark AO1 Data interpretation amino acids amides and chirality
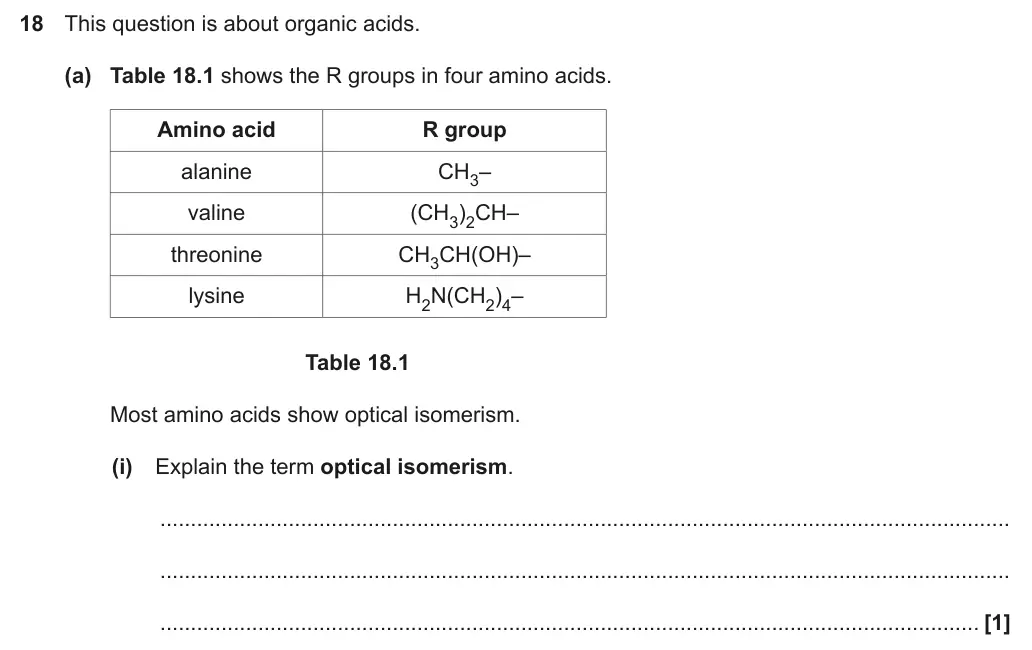
18 This question is about organic acids.
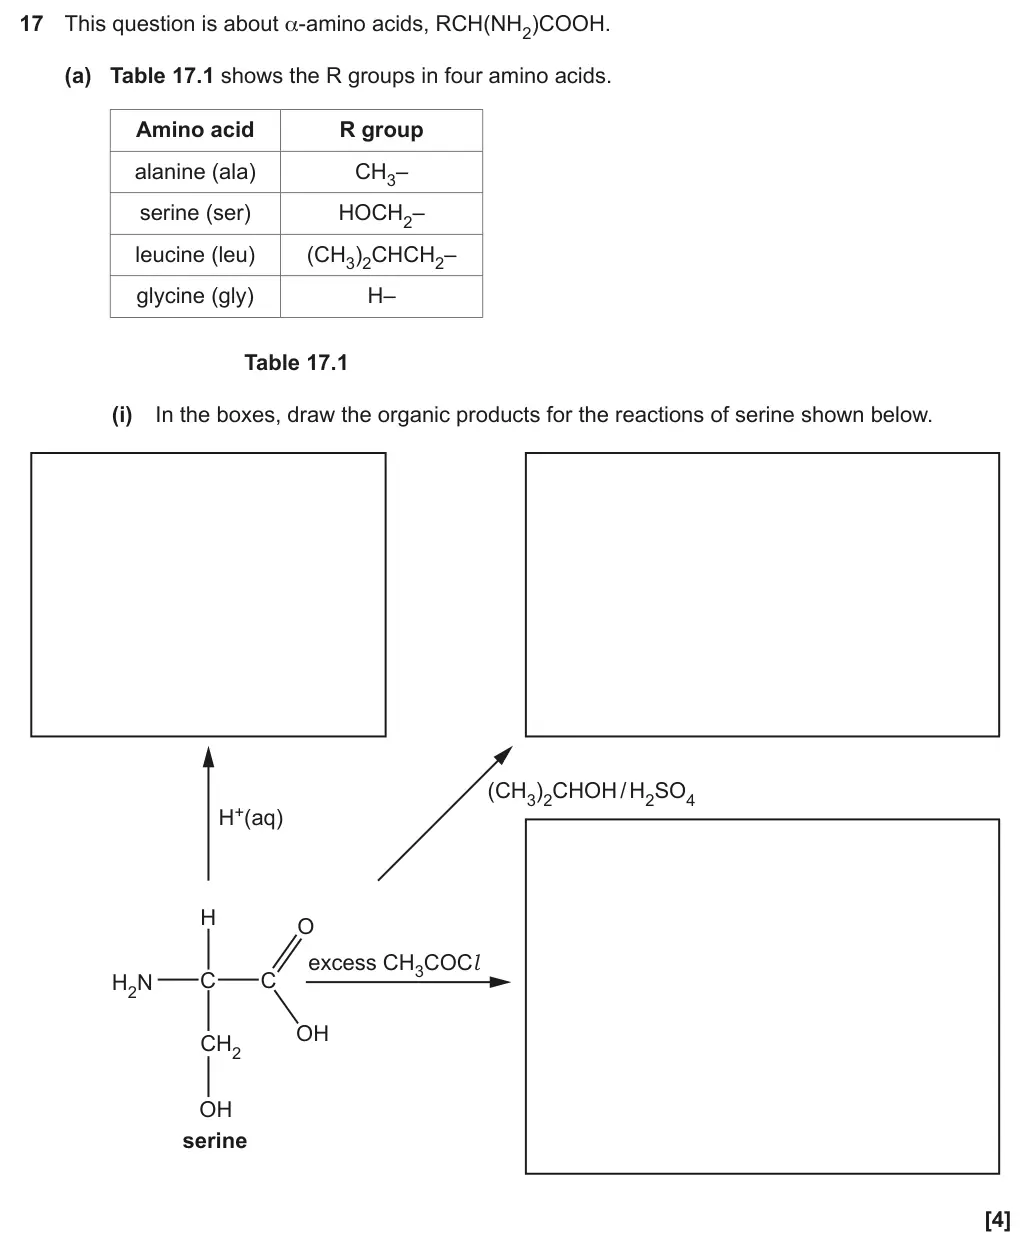
(a) Table 18.1 shows the R groups in four amino acids.
Amino acid R group
alanine CH3–
valine (CH3)2CH–
threonine CH3CH(OH)–
lysine H2N(CH2)4–
Table 18.1
Most amino acids show optical isomerism.
(i) Explain the term optical isomerism.
...........................................................................................................................................
...........................................................................................................................................
...................................................................................................................................... [1]
November 2021 · Paper 3 · Q3(b) 7 marks AO2, 3 Data interpretation Hard acids and titrationsamount of substanceorganic basicsalkenes
Earlier part of question 3 that this part usesEarlier part of November 2021 Paper 3 question 3
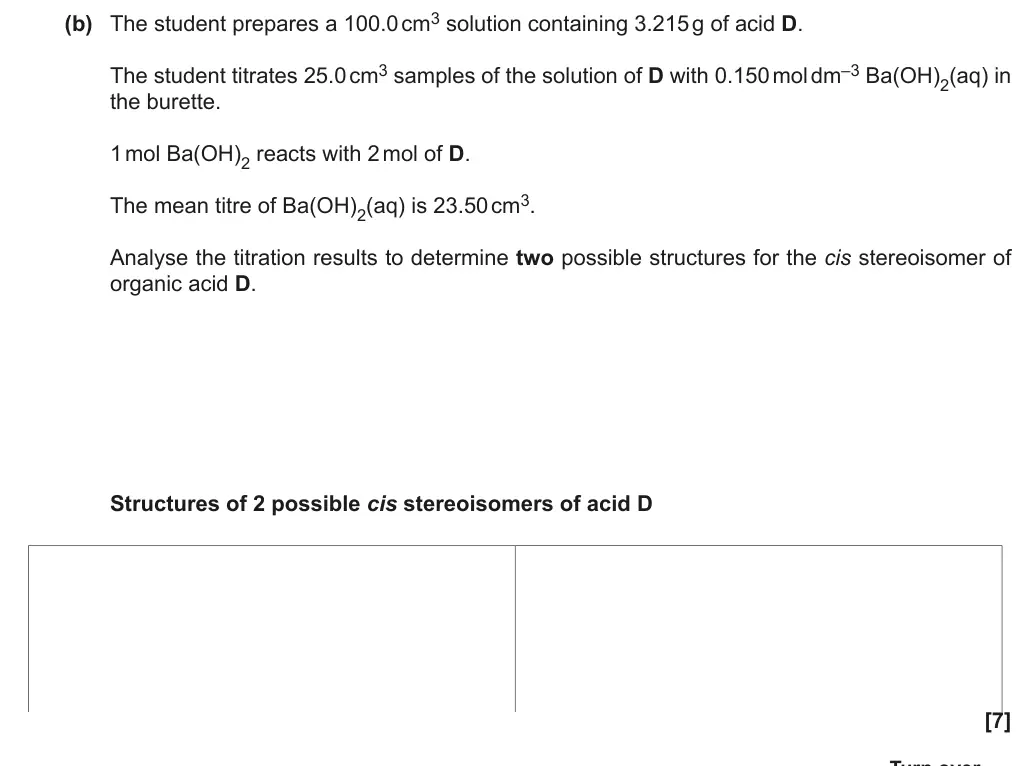
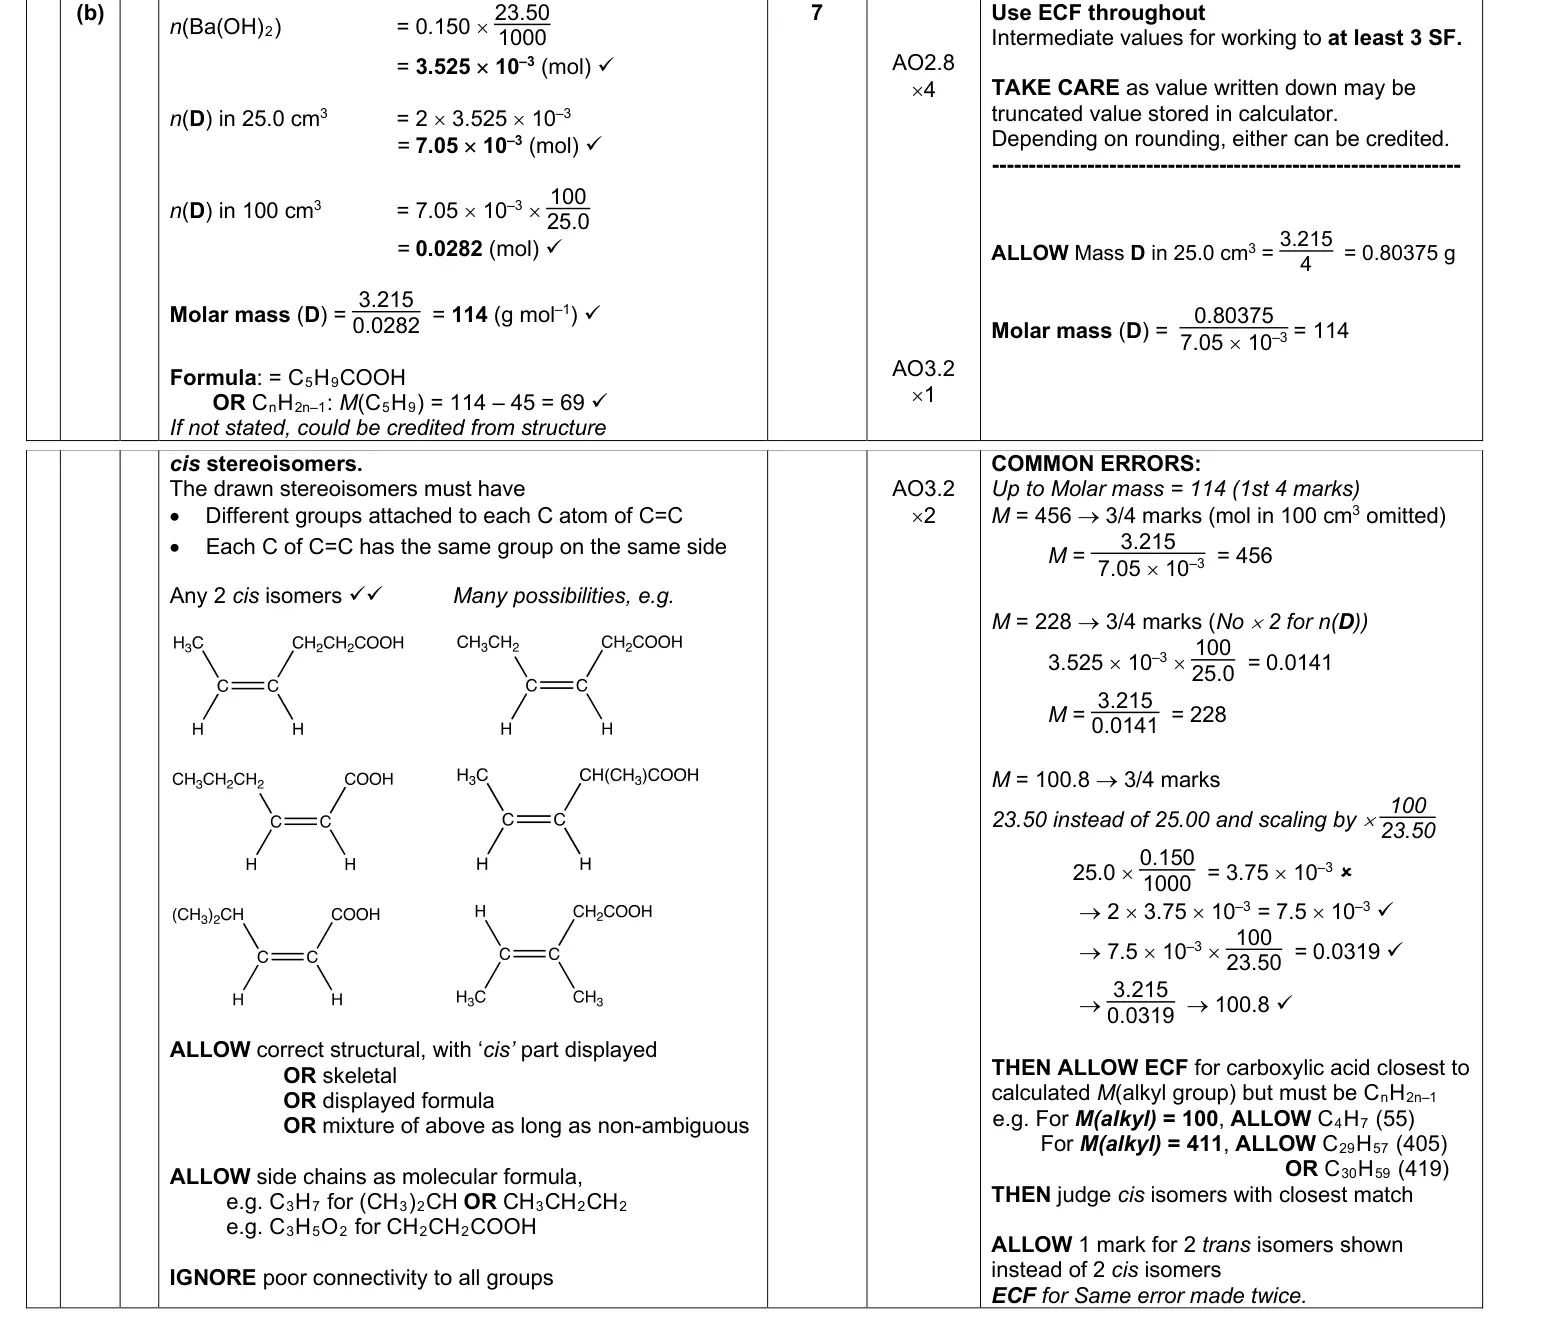
(b) The student prepares a 100.0 cm3 solution containing 3.215 g of acid D.
The student titrates 25.0 cm3 samples of the solution of D with 0.150 mol dm–3 Ba(OH)2(aq) in
the burette.
1 mol Ba(OH)2 reacts with 2 mol of D.
The mean titre of Ba(OH)2(aq) is 23.50 cm3.
Analyse the titration results to determine two possible structures for the cis stereoisomer of
organic acid D.
Structures of 2 possible cis stereoisomers of acid D
[7]
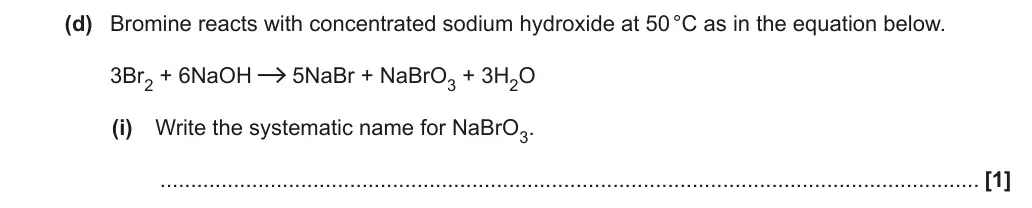
November 2020 · AS Paper 2 · Q3(d)(ii) 3 marks AO1, 2 Data interpretation Medium halogensredox
Earlier part of question 3 that this part usesEarlier part of November 2020 Paper 2 question 3
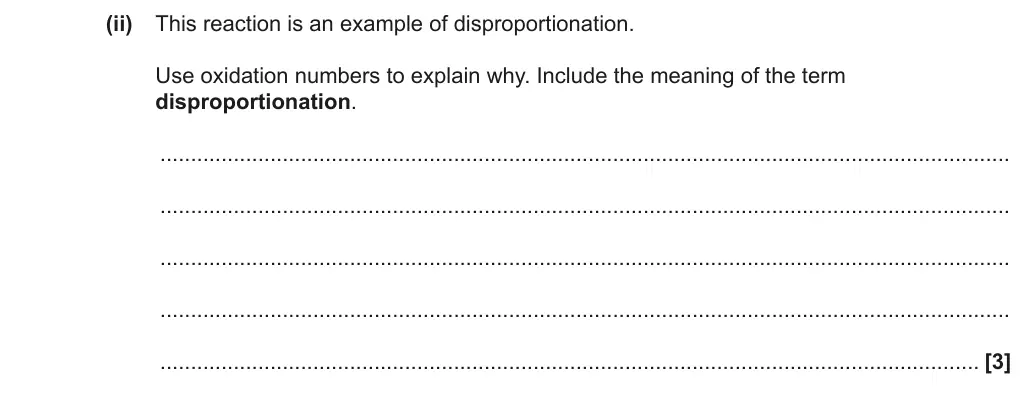
(ii) This reaction is an example of disproportionation.
Use oxidation numbers to explain why. Include the meaning of the term
disproportionation.
...........................................................................................................................................
...........................................................................................................................................
...........................................................................................................................................
...........................................................................................................................................
...................................................................................................................................... [3]
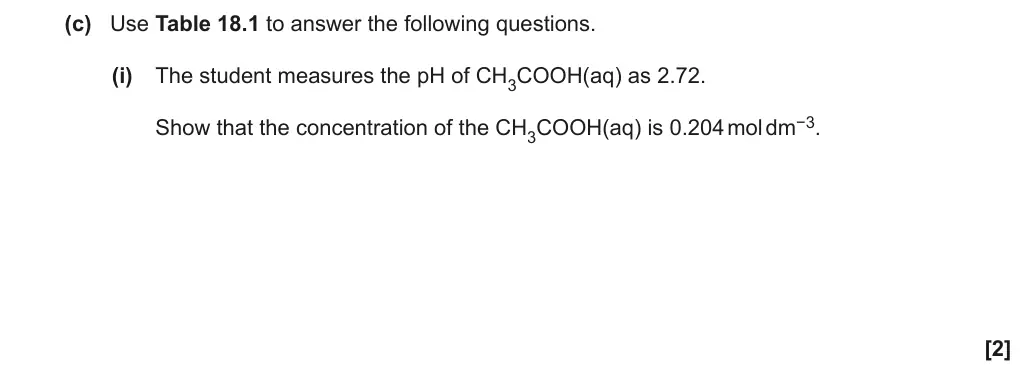
November 2020 · Paper 1 · Q18(c)(i) 2 marks AO2 Data interpretation acids bases and buffers
Earlier part of question 18 that this part usesEarlier part of November 2020 Paper 1 question 18
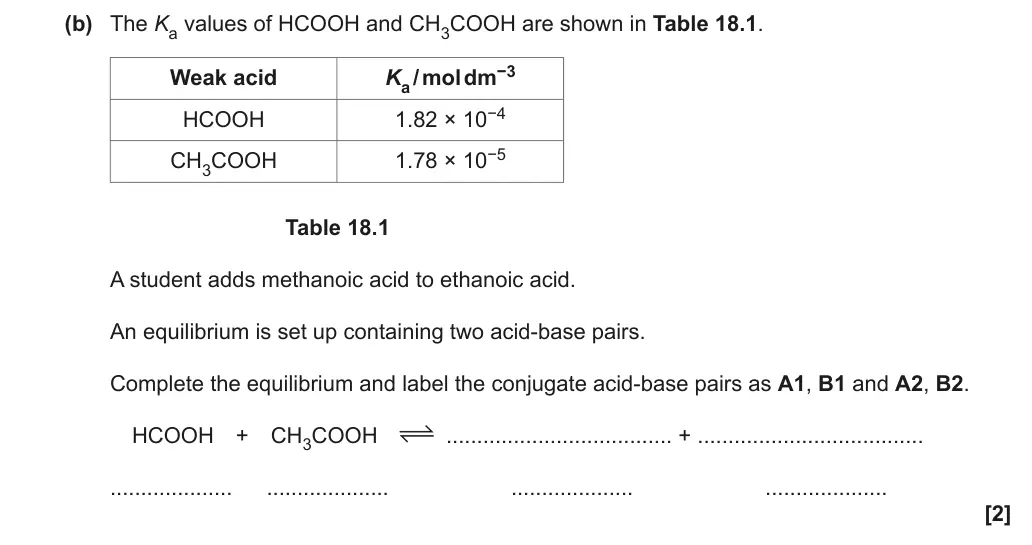
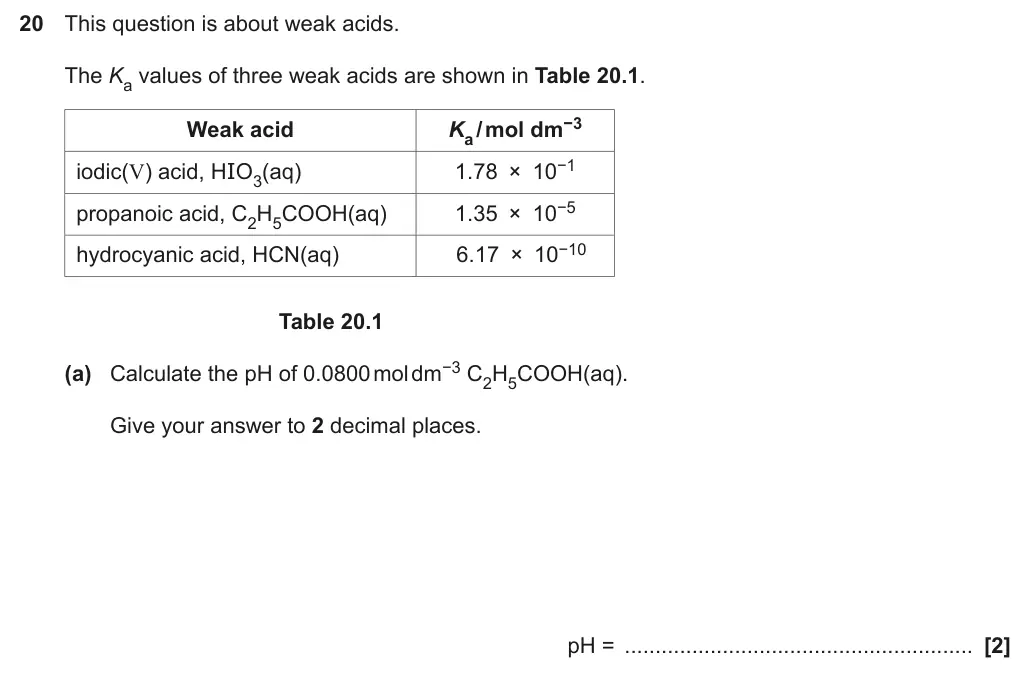
(c) Use Table 18.1 to answer the following questions.
(i) The student measures the pH of CH3COOH(aq) as 2.72.
Show that the concentration of the CH3COOH(aq) is 0.204 mol dm−3.
[2]
November 2020 · Paper 1 · Q22(c) 5 marks AO1, 2, 3 Data interpretation Medium redox and electrode potentialsamount of substance
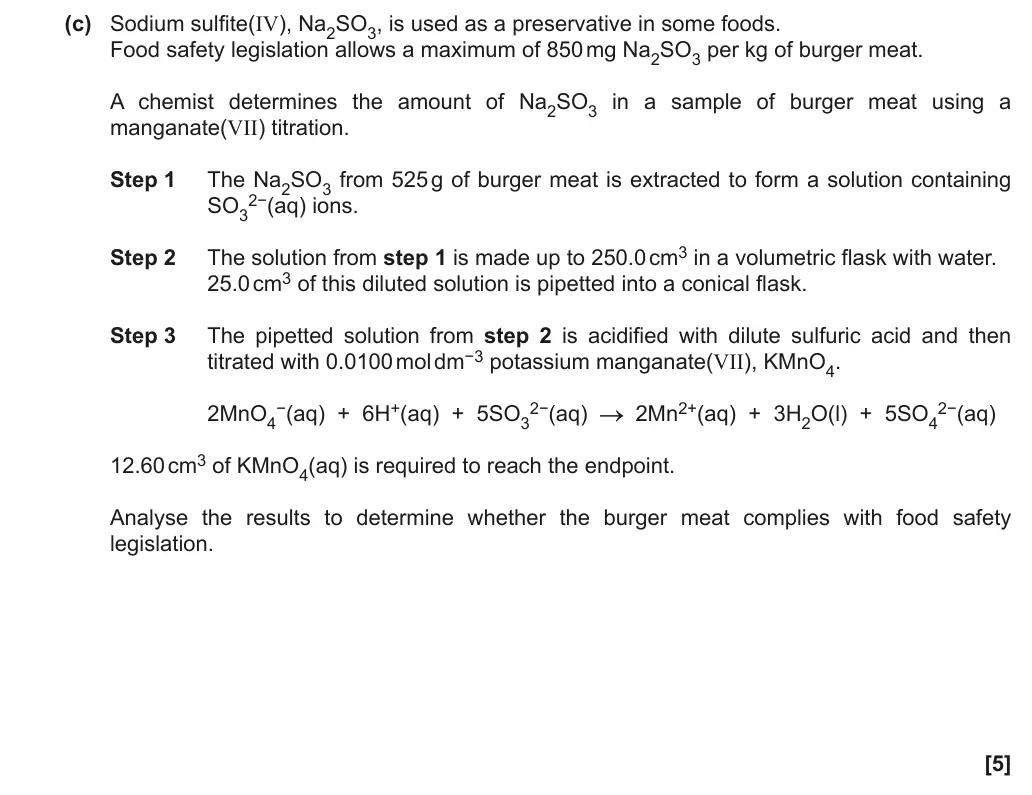
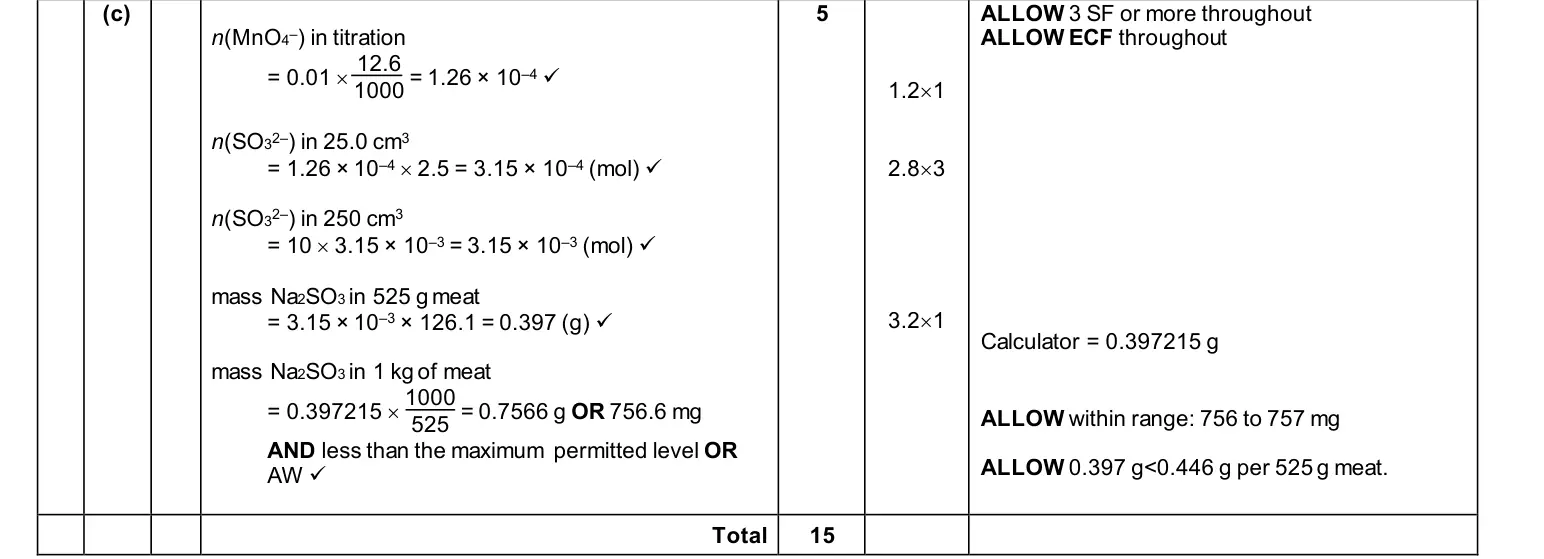
(c) Sodium sulfite(IV), Na2SO3, is used as a preservative in some foods.
Food safety legislation allows a maximum of 850 mg Na2SO3 per kg of burger meat.
A chemist determines the amount of Na2SO3 in a sample of burger meat using a
manganate(VII) titration.
Step 1 The Na2SO3 from 525 g of burger meat is extracted to form a solution containing
SO3 2−(aq) ions.
Step 2 The solution from step 1 is made up to 250.0 cm3 in a volumetric flask with water.
25.0 cm3 of this diluted solution is pipetted into a conical flask.
Step 3 The pipetted solution from step 2 is acidified with dilute sulfuric acid and then
titrated with 0.0100 mol dm−3 potassium manganate(VII), KMnO4.
2MnO4 −(aq)  +  6H+(aq)  +  5SO3 2−(aq) 2Mn2+(aq)  +  3H2O(l)  +  5SO4 2−(aq)
12.60 cm3 of KMnO4(aq) is required to reach the endpoint.
Analyse the results to determine whether the burger meat complies with food safety
legislation.
[5]
June 2019 · AS Paper 2 · Q4(b)(ii) 1 mark AO2 Data interpretation Easy practical skills
Earlier parts of question 4 that this part usesEarlier part of June 2019 Paper 2 question 4Earlier part of June 2019 Paper 2 question 4
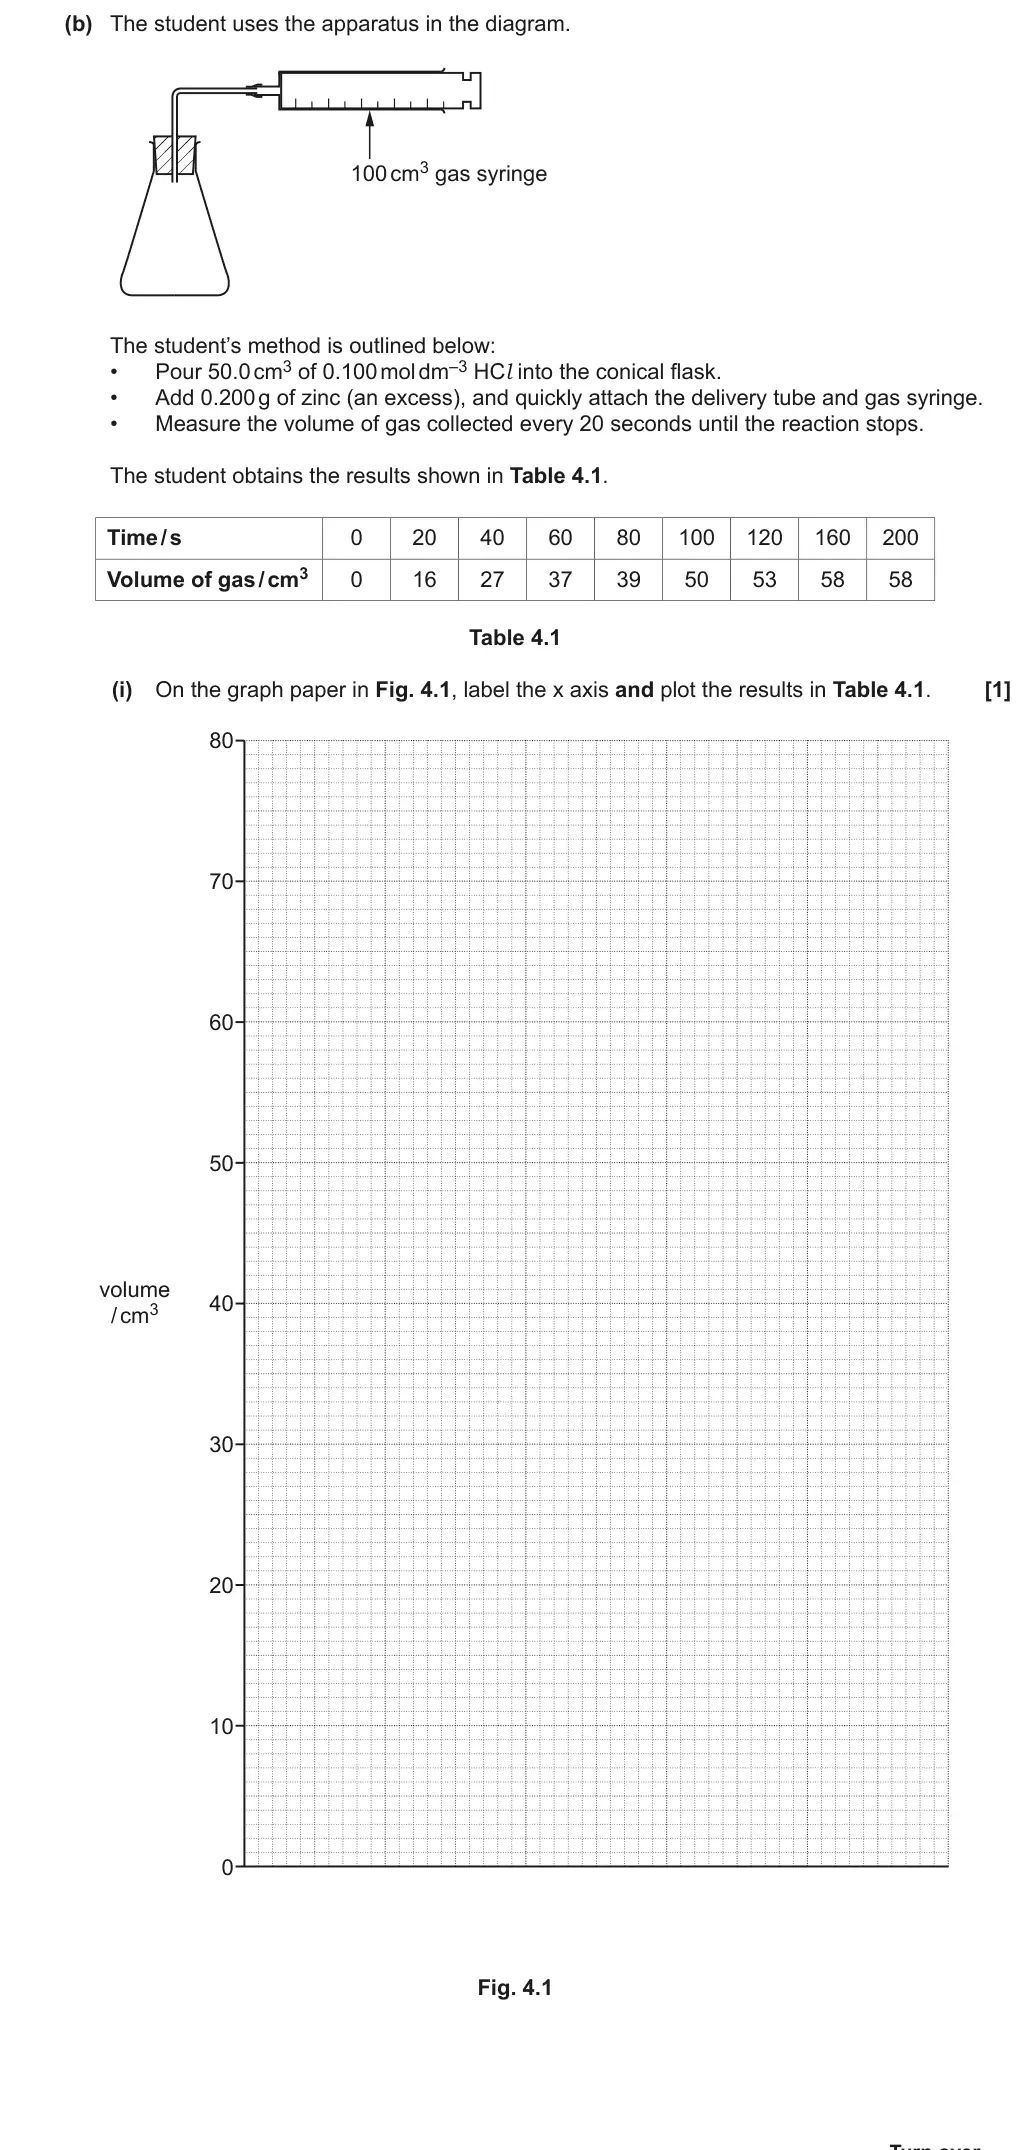
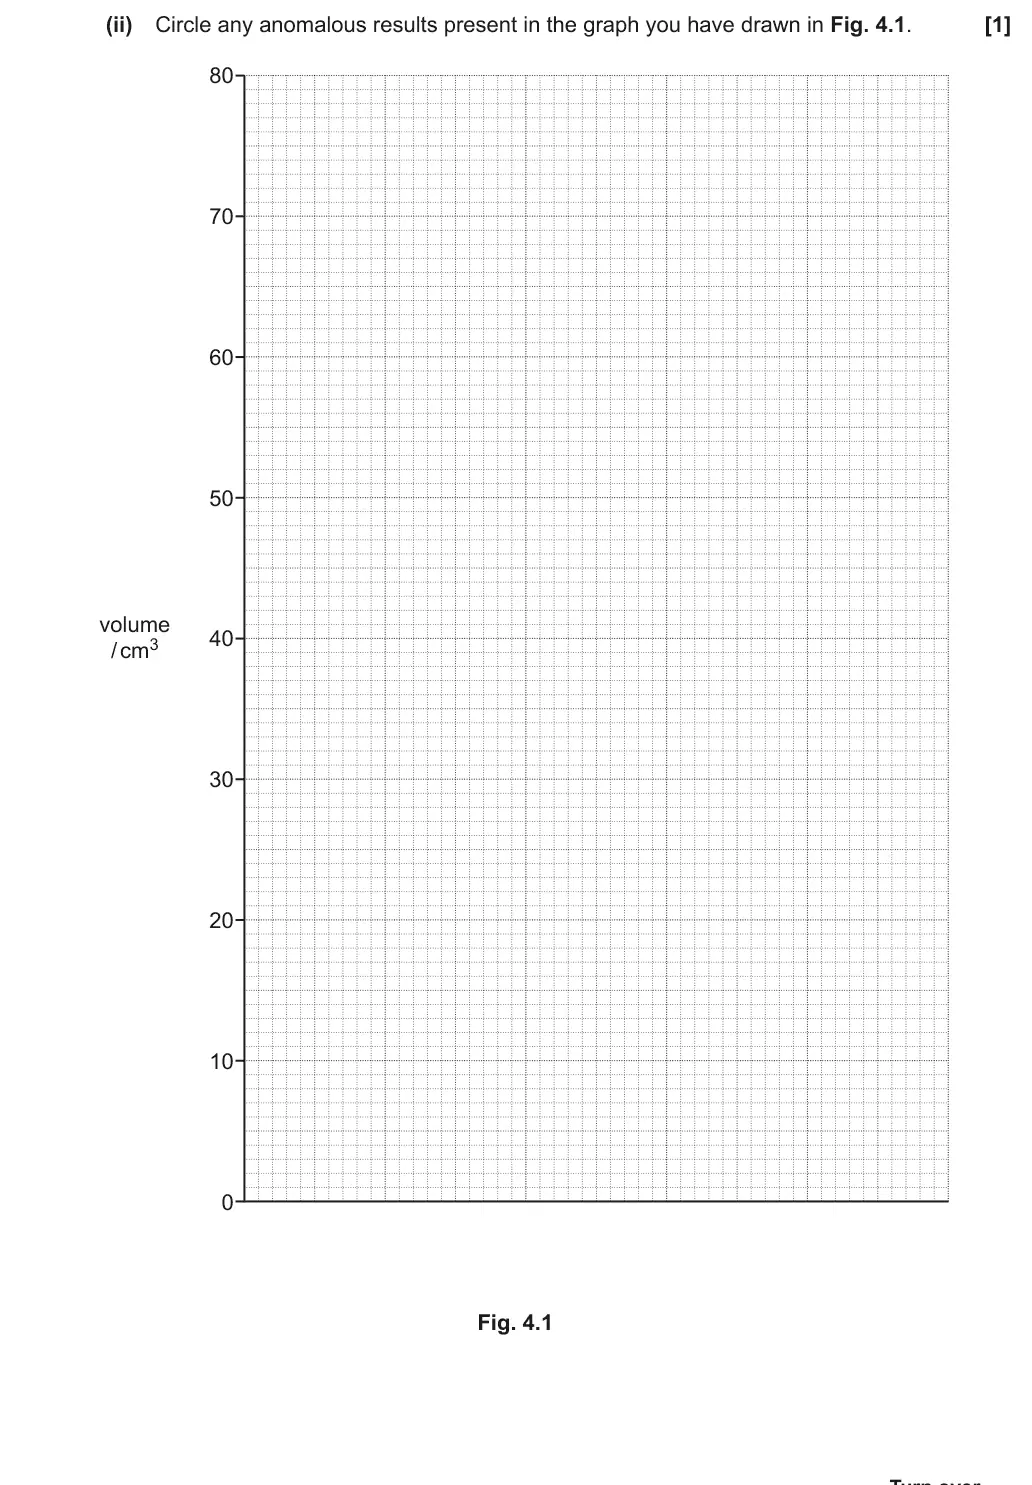
(ii) Circle any anomalous results present in the graph you have drawn in Fig. 4.1. [1]
June 2019 · AS Paper 2 · Q4(c) 2 marks AO2 Data interpretation Medium reaction ratesamount of substance
Earlier parts of question 4 that this part usesEarlier part of June 2019 Paper 2 question 4Earlier part of June 2019 Paper 2 question 4
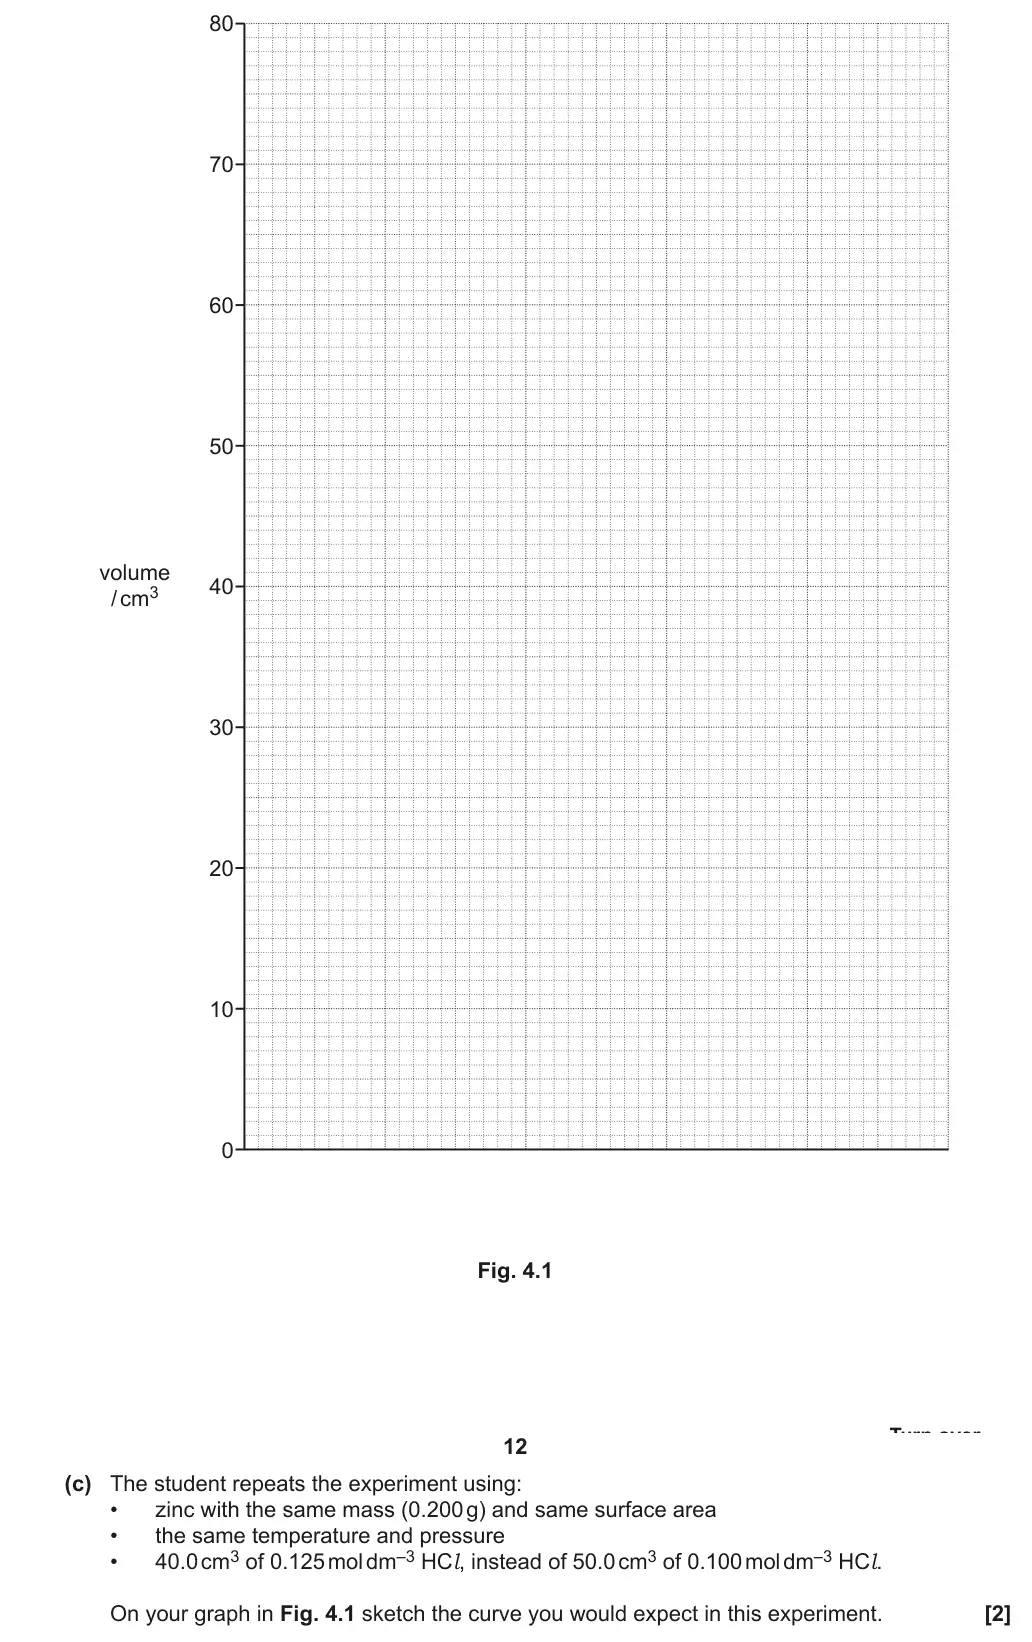
80
70
60
50
volume
40
/ cm3
30
20
10
0
Fig. 4.1
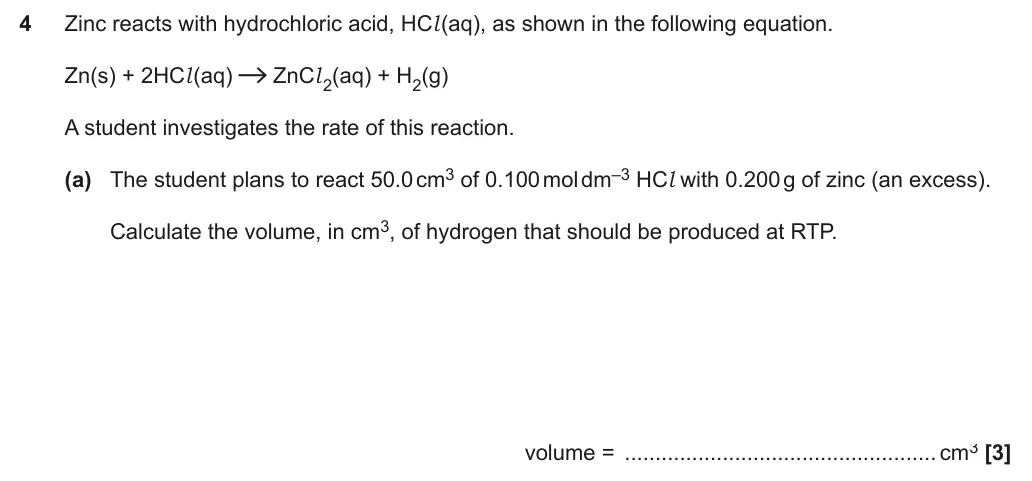
(c) The student repeats the experiment using:
• zinc with the same mass (0.200 g) and same surface area
• the same temperature and pressure
• 40.0 cm3 of 0.125 mol dm–3 HCl, instead of 50.0 cm3 of 0.100 mol dm–3 HCl.
On your graph in Fig. 4.1 sketch the curve you would expect in this experiment. [2]
June 2019 · Paper 1 · Q18(b)(ii) 3 marks AO3 Data interpretation Medium redox and electrode potentialstransition elements
Earlier part of question 18 that this part usesEarlier part of June 2019 Paper 1 question 18
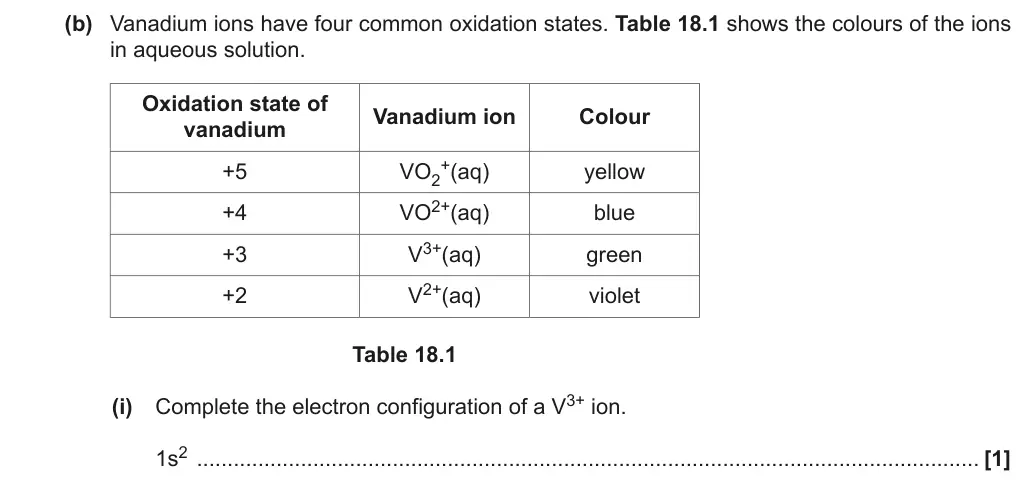
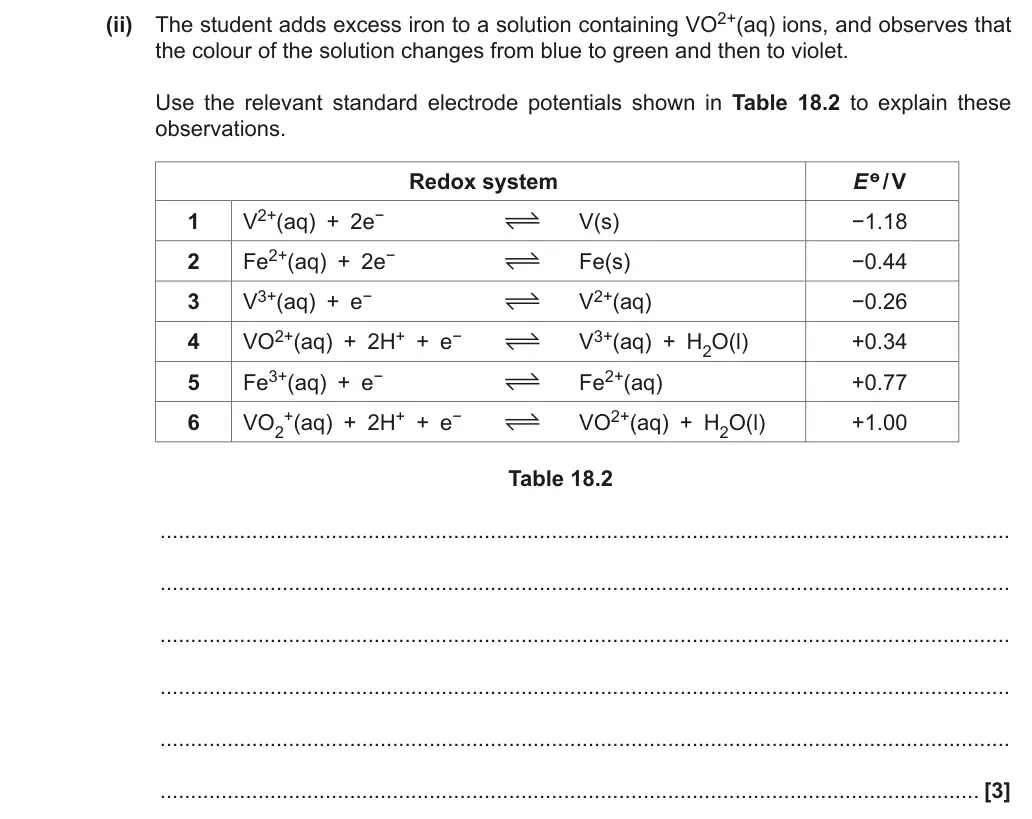
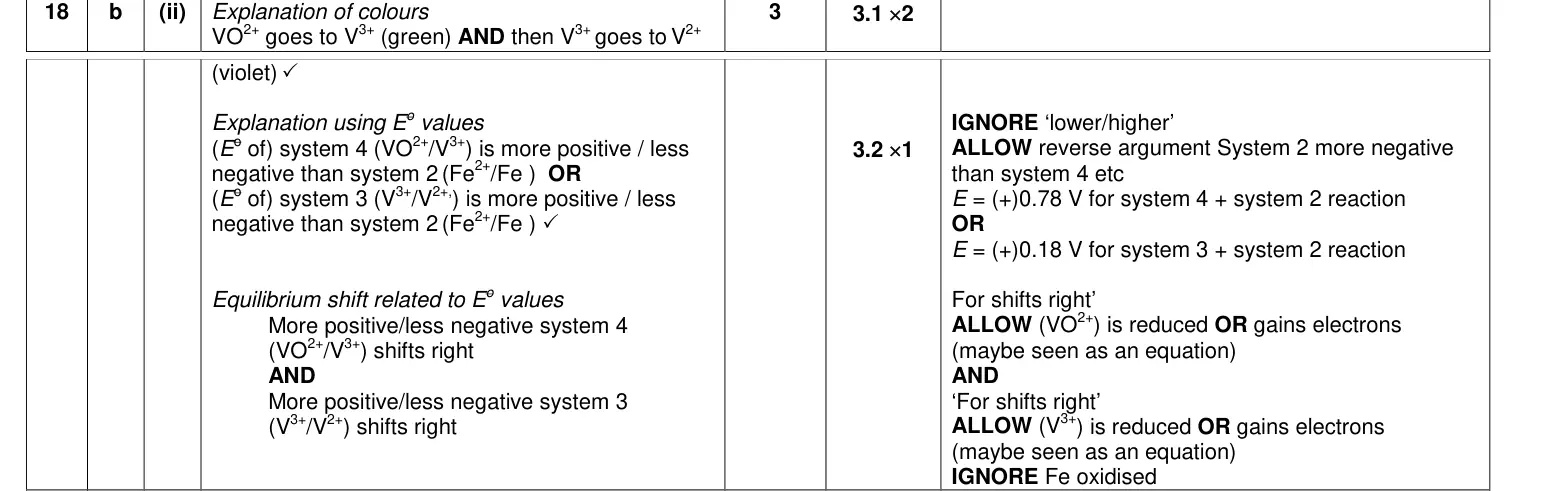
(ii) The student adds excess iron to a solution containing VO2+(aq) ions, and observes that
the colour of the solution changes from blue to green and then to violet.
Use the relevant standard electrode potentials shown in Table 18.2 to explain these
observations.
Redox system Eө / V
1 V2+(aq) + 2e− V(s) −1.18
2 Fe2+(aq) + 2e− Fe(s) −0.44
3 V3+(aq) + e− V2+(aq) −0.26
4 VO2+(aq) + 2H+ + e− V3+(aq) + H2O(l) +0.34
5 Fe3+(aq) + e− Fe2+(aq) +0.77
6 VO2 +(aq) + 2H+ + e− VO2+(aq) + H2O(l) +1.00
Table 18.2
...........................................................................................................................................
...........................................................................................................................................
...........................................................................................................................................
...........................................................................................................................................
...........................................................................................................................................
...................................................................................................................................... [3]
June 2019 · Paper 1 · Q18(c)(iii) 1 mark AO3 Data interpretation Hard amount of substanceatomic structure and isotopes
Earlier part of question 18 that this part usesEarlier part of June 2019 Paper 1 question 18
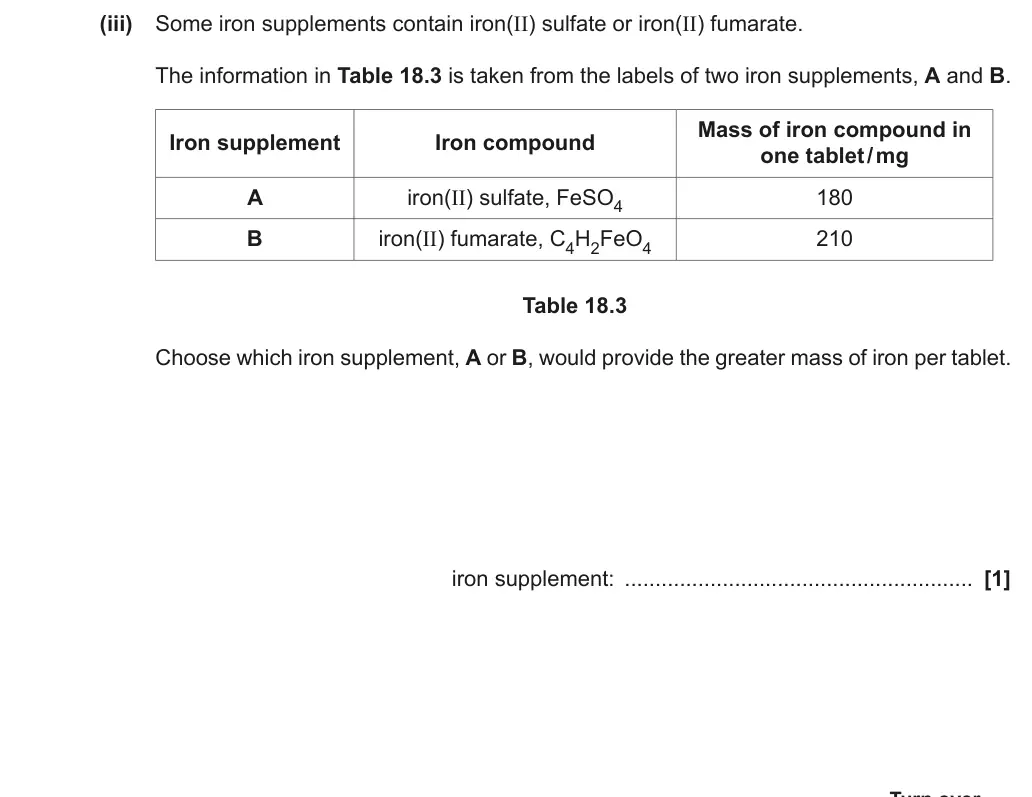
(iii) Some iron supplements contain iron(II) sulfate or iron(II) fumarate.
The information in Table 18.3 is taken from the labels of two iron supplements, A and B.
Mass of iron compound in
Iron supplement Iron compound
one tablet / mg
A iron(II) sulfate, FeSO4 180
B iron(II) fumarate, C4H2FeO4 210
Table 18.3
Choose which iron supplement, A or B, would provide the greater mass of iron per tablet.
iron supplement:  ......................................................... [1]
June 2019 · Paper 1 · Q20(b)(iv) 1 mark AO3 Data interpretation Medium acids bases and buffers
Earlier part of question 20 that this part usesEarlier part of June 2019 Paper 1 question 20
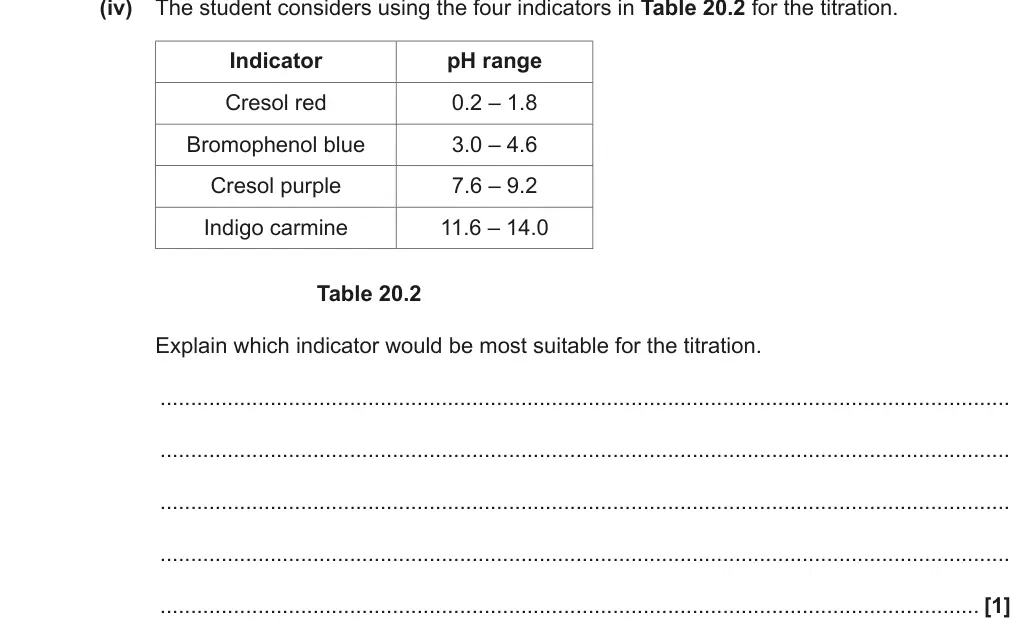
(iv)  The student considers using the four indicators in Table 20.2 for the titration.
Indicator pH range
Cresol red 0.2 – 1.8
Bromophenol blue 3.0 – 4.6
Cresol purple 7.6 – 9.2
Indigo carmine 11.6 – 14.0
Table 20.2
Explain which indicator would be most suitable for the titration.
...........................................................................................................................................
...........................................................................................................................................
...........................................................................................................................................
...........................................................................................................................................
...................................................................................................................................... [1]
June 2019 · Paper 1 · Q20(b)(v) 2 marks AO3 Data interpretation Medium acids bases and buffers
Earlier parts of question 20 that this part usesEarlier part of June 2019 Paper 1 question 20Earlier part of June 2019 Paper 1 question 20
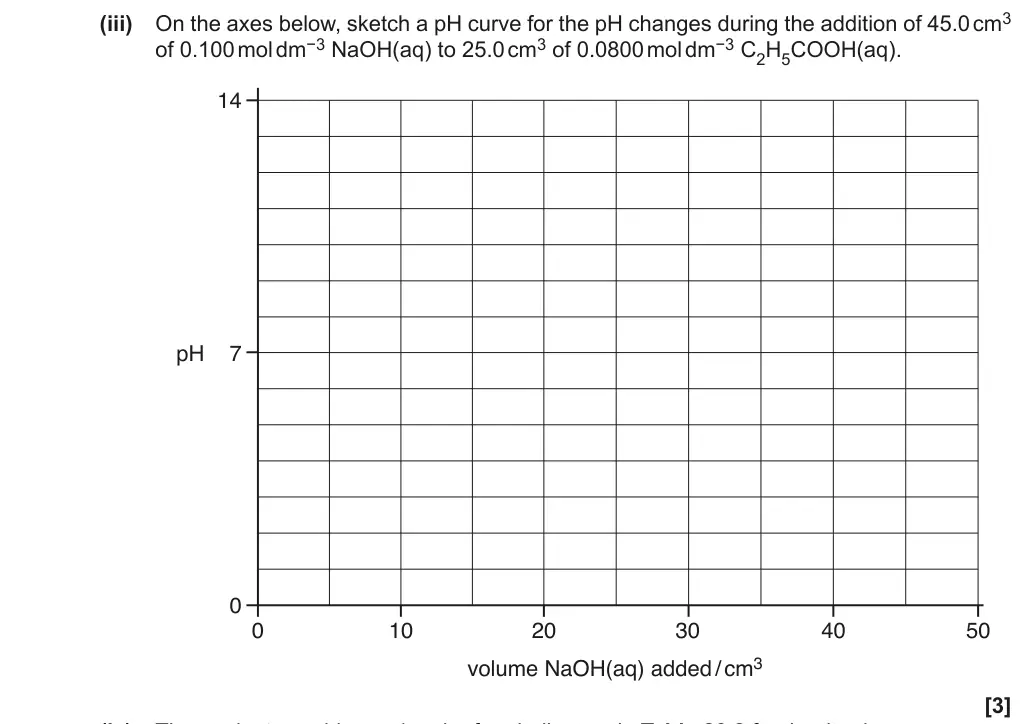
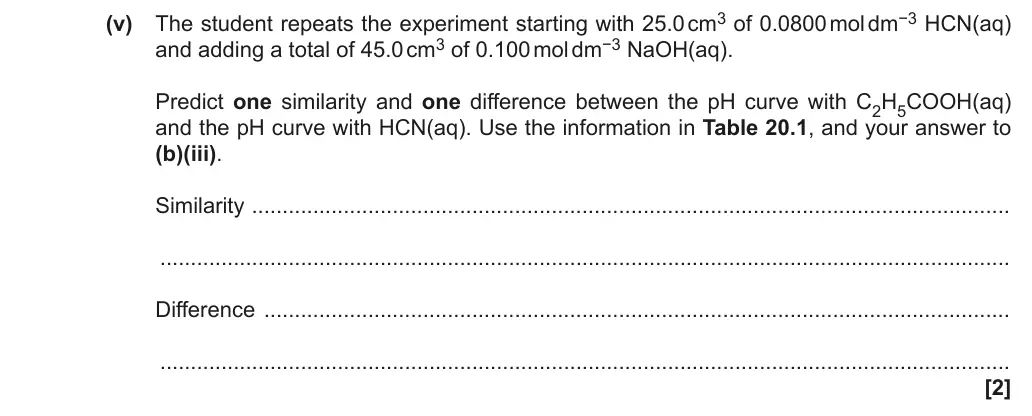
(v) The student repeats the experiment starting with 25.0 cm3 of 0.0800 mol dm−3 HCN(aq)
and adding a total of 45.0 cm3 of 0.100 mol dm−3 NaOH(aq).
Predict one similarity and one difference between the pH curve with C2H5COOH(aq)
and the pH curve with HCN(aq). Use the information in Table 20.1, and your answer to
(b)(iii).
Similarity  ............................................................................................................................
...........................................................................................................................................
Difference  ..........................................................................................................................
...........................................................................................................................................
[2]
June 2019 · Paper 2 · Q17(a)(ii) 4 marks AO2, 3 Data interpretation Easy acids and titrationsamount of substanceamino acids amides and chirality
Earlier part of question 17 that this part usesEarlier part of June 2019 Paper 2 question 17
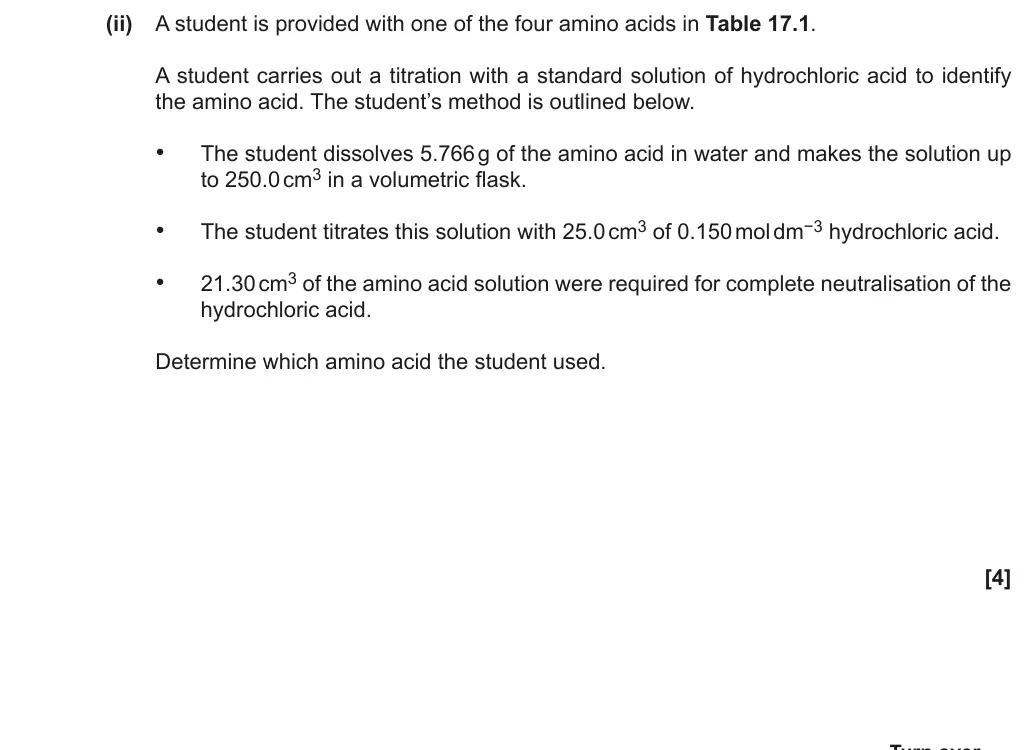
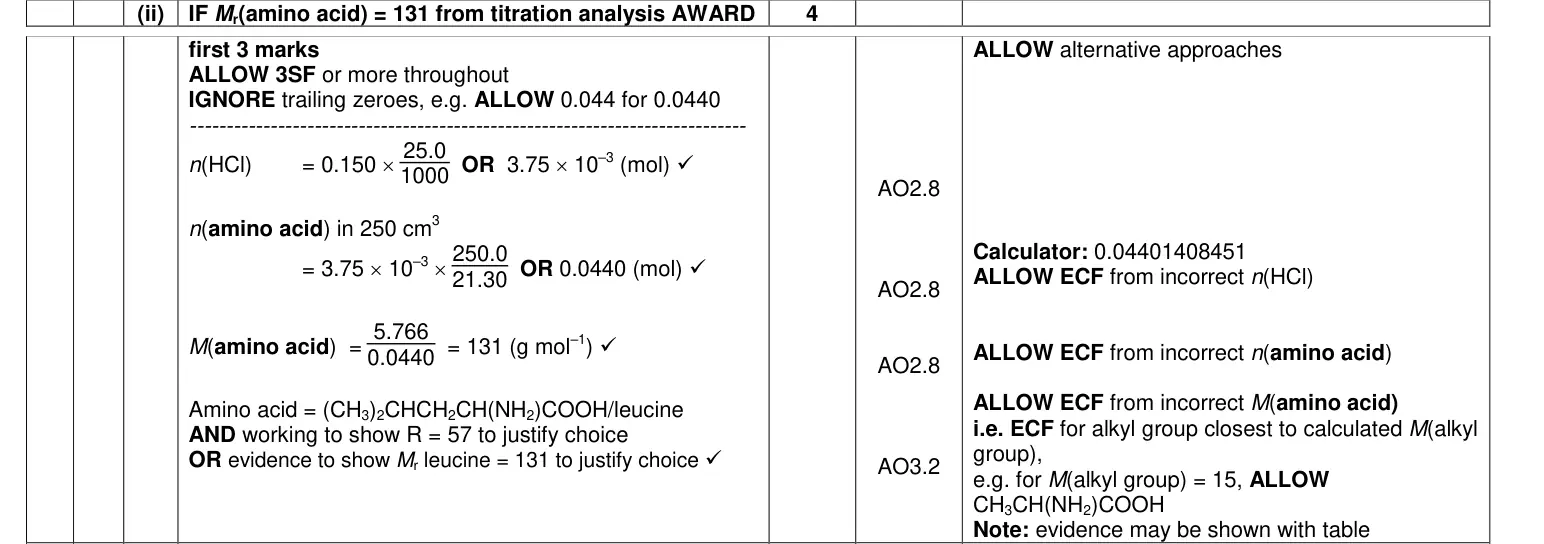
(ii) A student is provided with one of the four amino acids in Table 17.1.
A student carries out a titration with a standard solution of hydrochloric acid to identify
the amino acid. The student’s method is outlined below.
• The student dissolves 5.766 g of the amino acid in water and makes the solution up
to 250.0 cm3 in a volumetric flask.
• The student titrates this solution with 25.0 cm3 of 0.150 mol dm−3 hydrochloric acid.
• 21.30 cm3 of the amino acid solution were required for complete neutralisation of the
hydrochloric acid.
Determine which amino acid the student used.
[4]
June 2019 · Paper 2 · Q17(b)(ii) 2 marks AO2 Data interpretation Easy chromatography and functional group tests
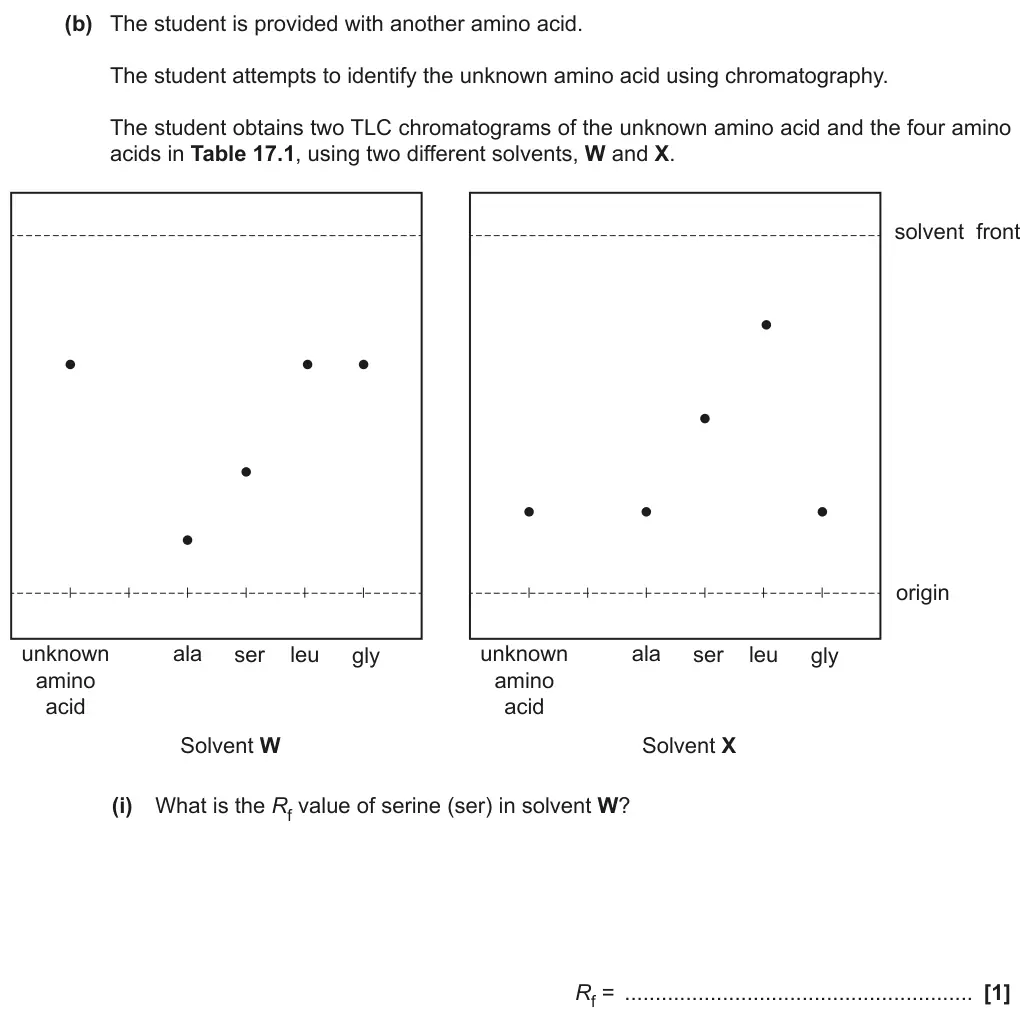
Earlier parts of question 17 that this part usesEarlier part of June 2019 Paper 2 question 17Earlier part of June 2019 Paper 2 question 17
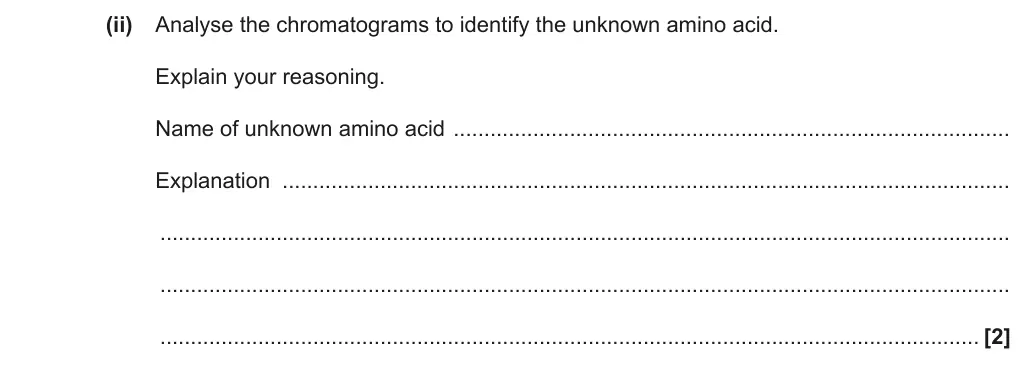
(ii) Analyse the chromatograms to identify the unknown amino acid.
Explain your reasoning.
Name of unknown amino acid  ...........................................................................................
Explanation  .......................................................................................................................
...........................................................................................................................................
...........................................................................................................................................
...................................................................................................................................... [2]
June 2019 · Paper 2 · Q20(a)(iii) 2 marks AO1 Data interpretation Medium organic basics
Earlier part of question 20 that this part usesEarlier part of June 2019 Paper 2 question 20
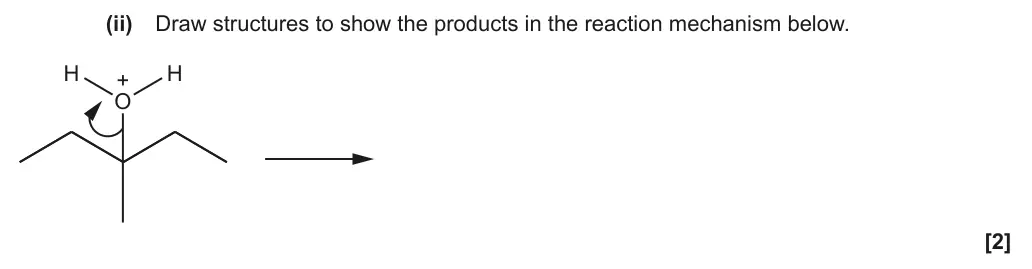
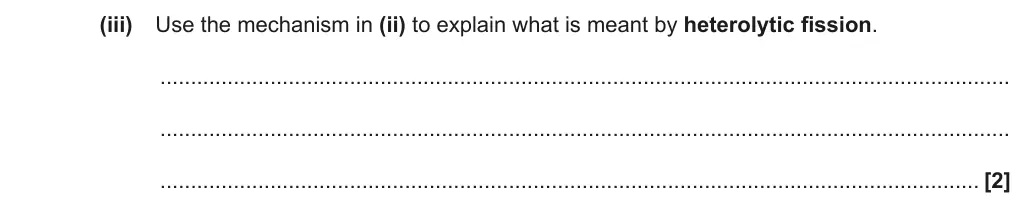
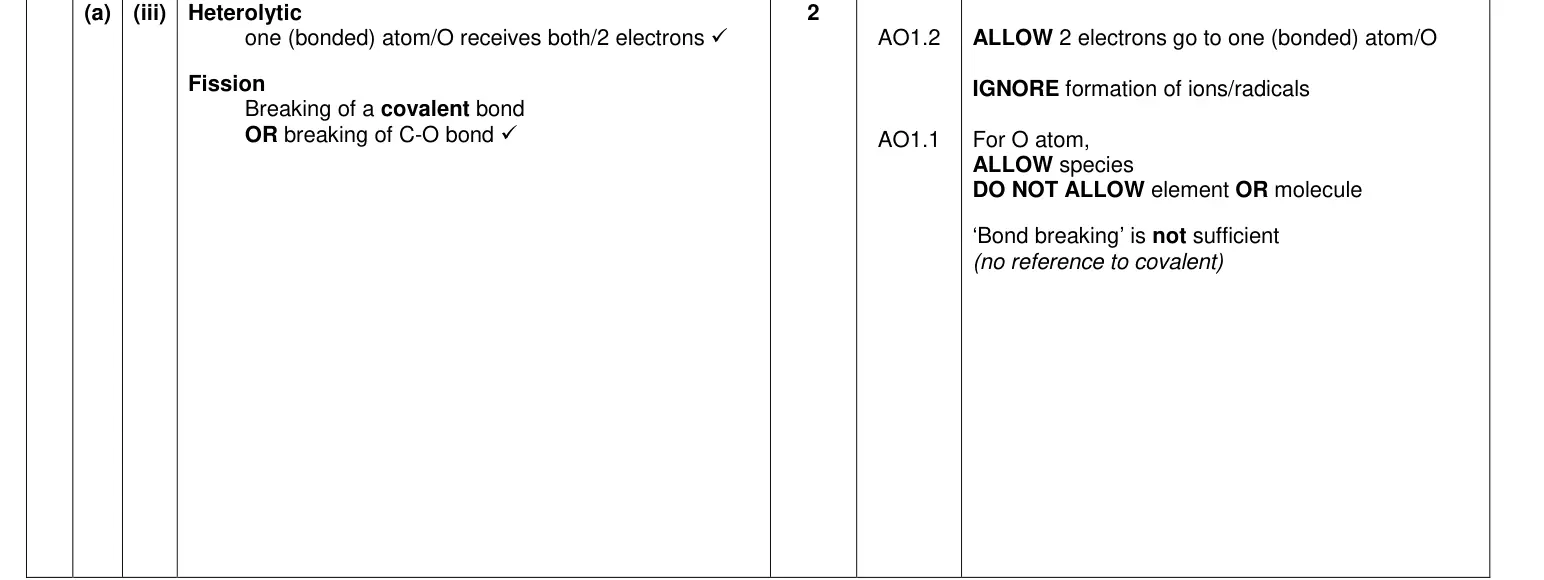
(iii) Use the mechanism in (ii) to explain what is meant by heterolytic fission.
...........................................................................................................................................
...........................................................................................................................................
...................................................................................................................................... [2]
June 2018 · AS Paper 1 · Q25(b)(ii) 2 marks Data interpretation Medium infrared and mass spectrometry
Earlier part of question 25 that this part usesEarlier part of June 2018 Paper 1 question 25
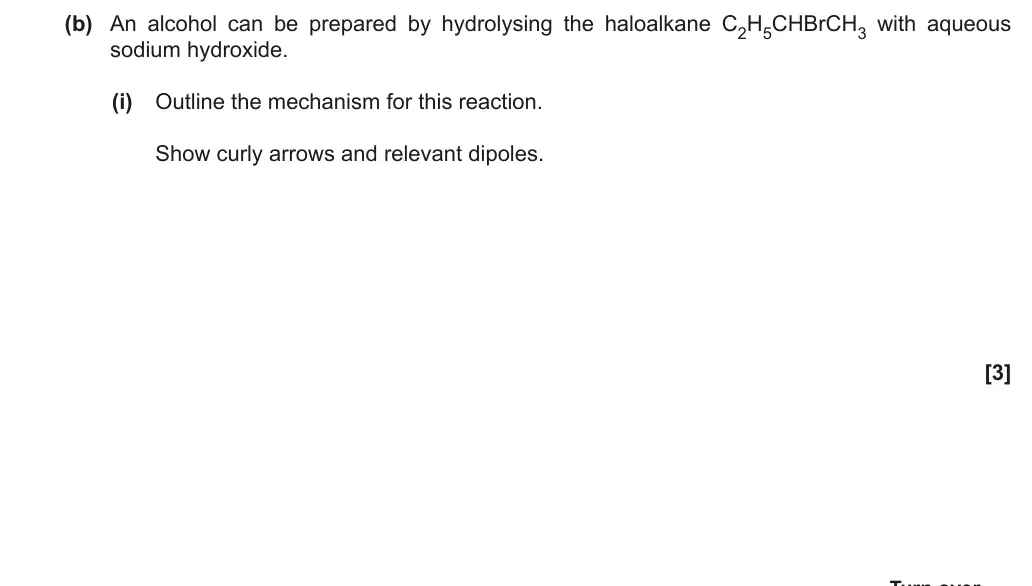
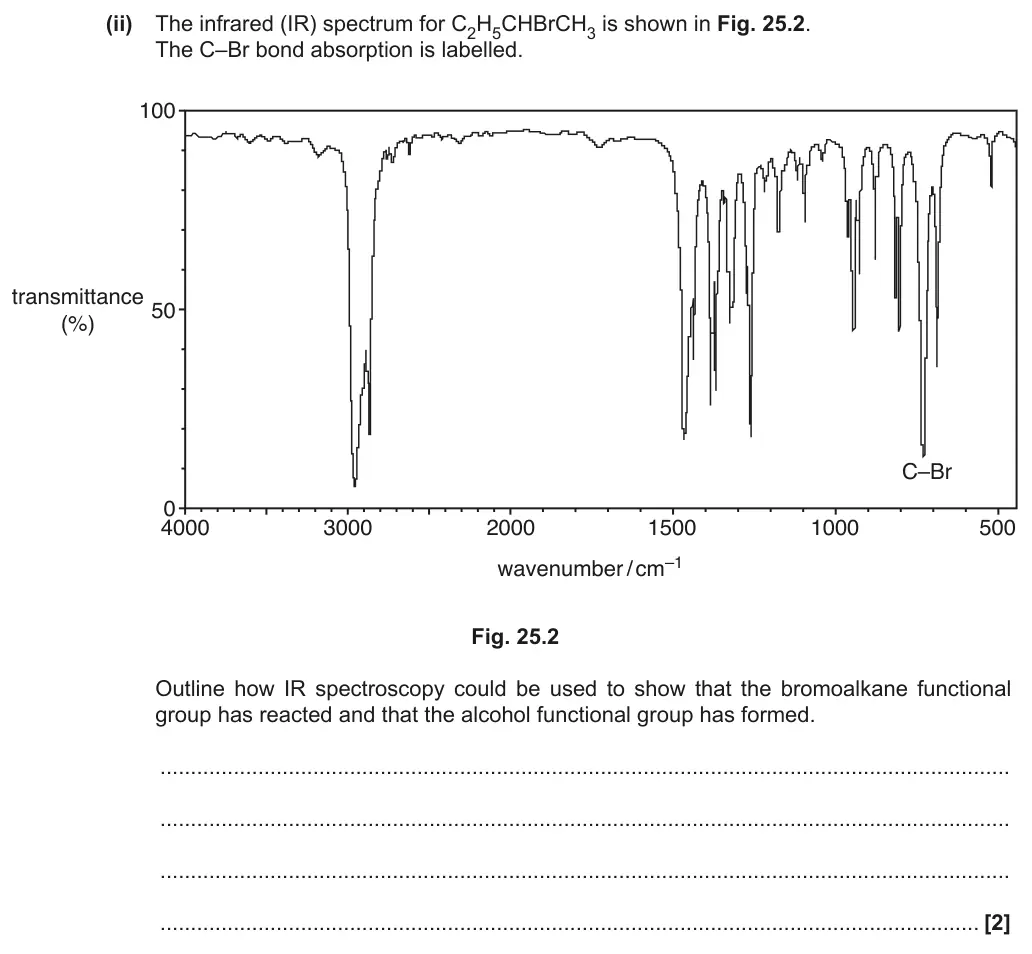
(ii) The infrared (IR) spectrum for C2H5CHBrCH3 is shown in Fig. 25.2.
The C–Br bond absorption is labelled.
100
transmittance
50
(%)
C–Br
0
4000 3000 2000 1500 1000 500
wavenumber / cm–1
Fig. 25.2
Outline how IR spectroscopy could be used to show that the bromoalkane functional
group has reacted and that the alcohol functional group has formed.
...........................................................................................................................................
...........................................................................................................................................
...........................................................................................................................................
...................................................................................................................................... [2]
June 2018 · Paper 1 · Q16(a)(i) 2 marks Data interpretation Easy lattice enthalpy
SECTION B
Answer all the questions.
16 This question is about enthalpy changes.
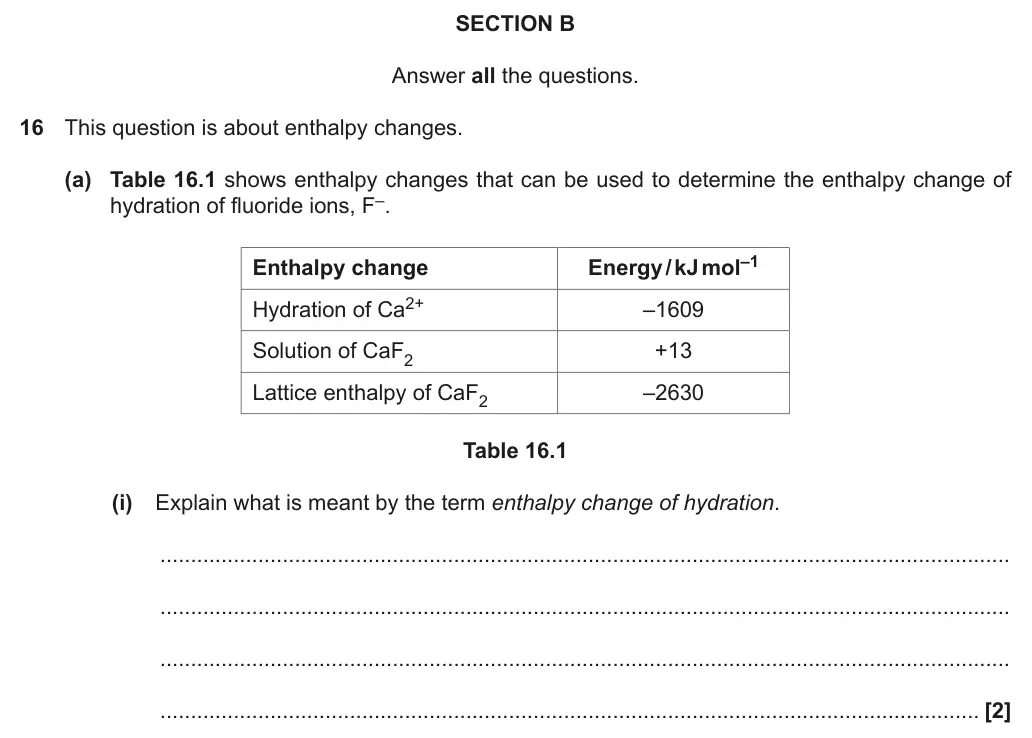
(a) Table 16.1 shows enthalpy changes that can be used to determine the enthalpy change of
hydration of fluoride ions, F–.
Enthalpy change Energy / kJ mol–1
Hydration of Ca2+ –1609
Solution of CaF2 +13
Lattice enthalpy of CaF2 –2630
Table 16.1
(i) Explain what is meant by the term enthalpy change of hydration.
...........................................................................................................................................
...........................................................................................................................................
...........................................................................................................................................
...................................................................................................................................... [2]
June 2018 · Paper 2 · Q21(c)(ii) 3 marks Data interpretation Easy infrared and mass spectrometryorganic basics
Earlier part of question 21 that this part usesEarlier part of June 2018 Paper 2 question 21
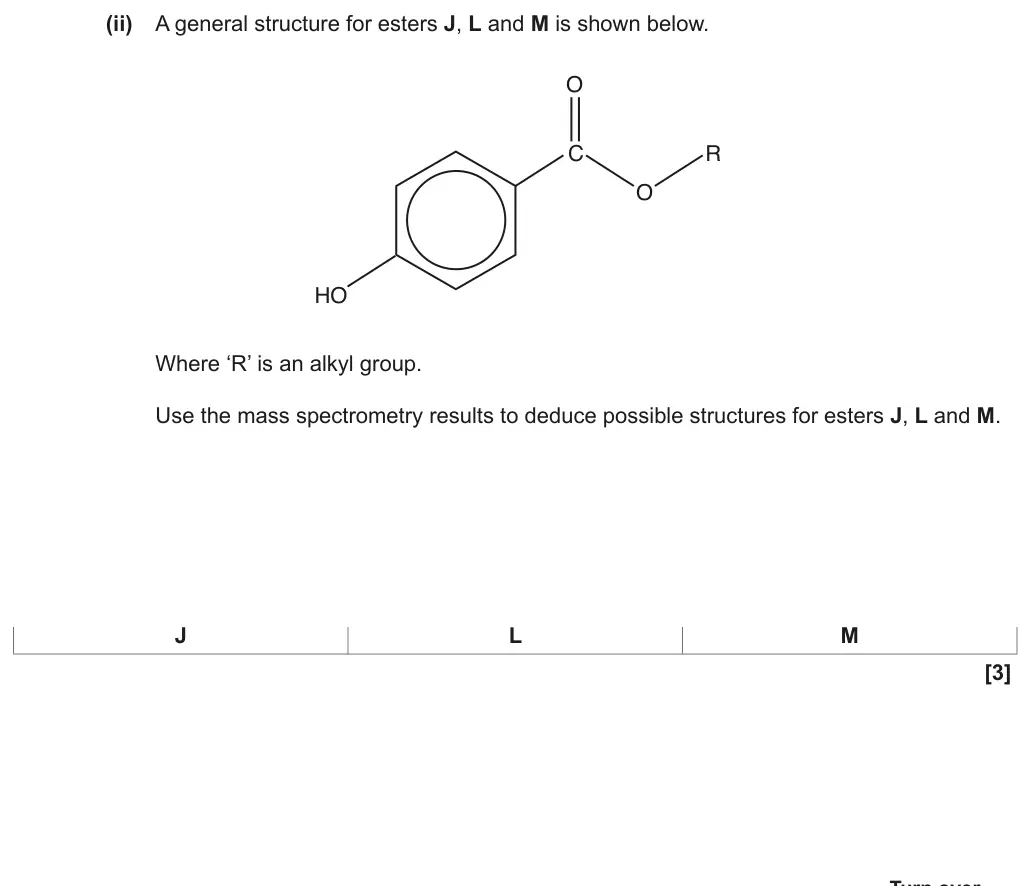
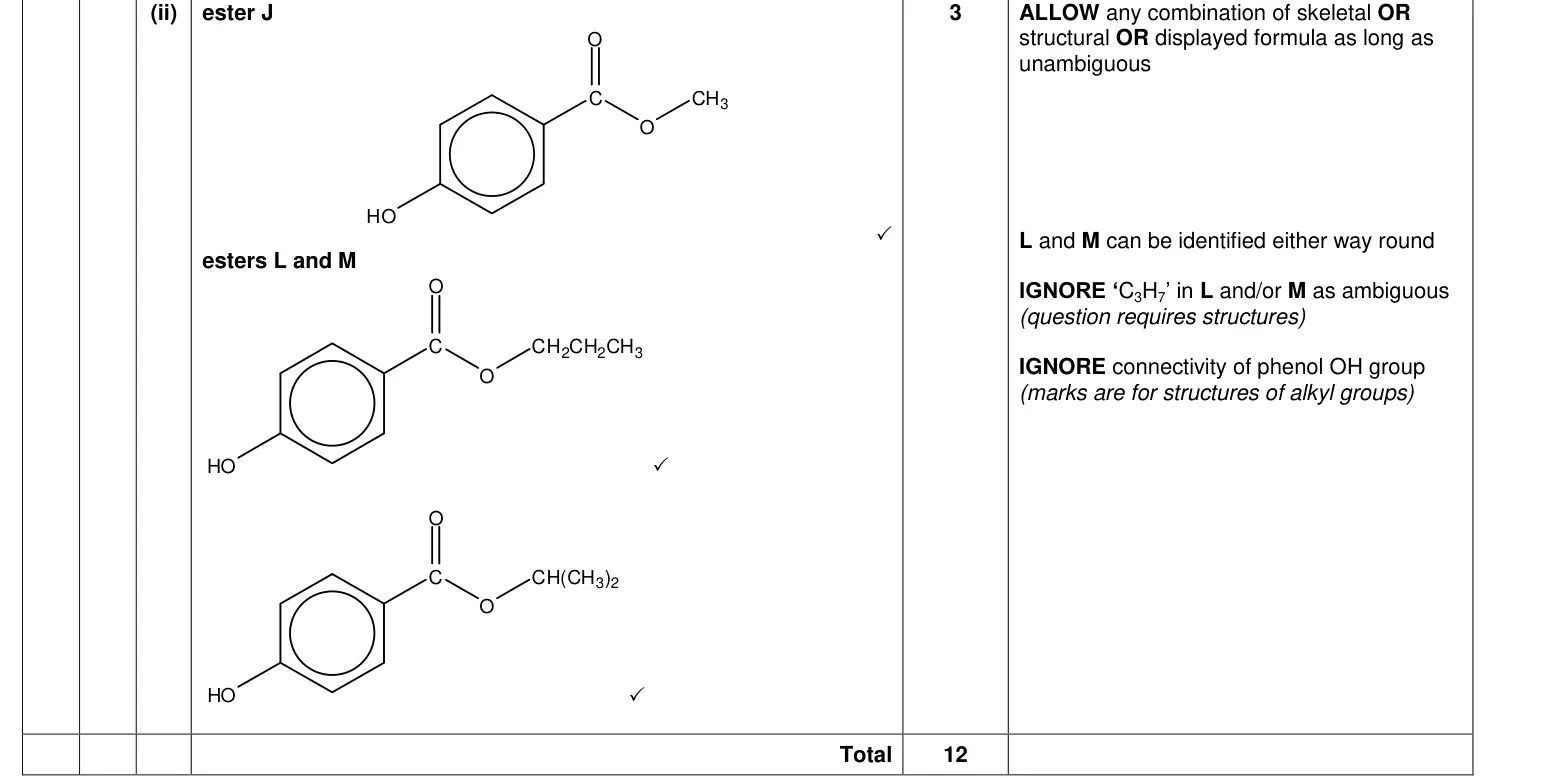
(ii) A general structure for esters J, L and M is shown below.
O
C R
O
HO
Where ‘R’ is an alkyl group.
Use the mass spectrometry results to deduce possible structures for esters J, L and M.
J L M
[3]
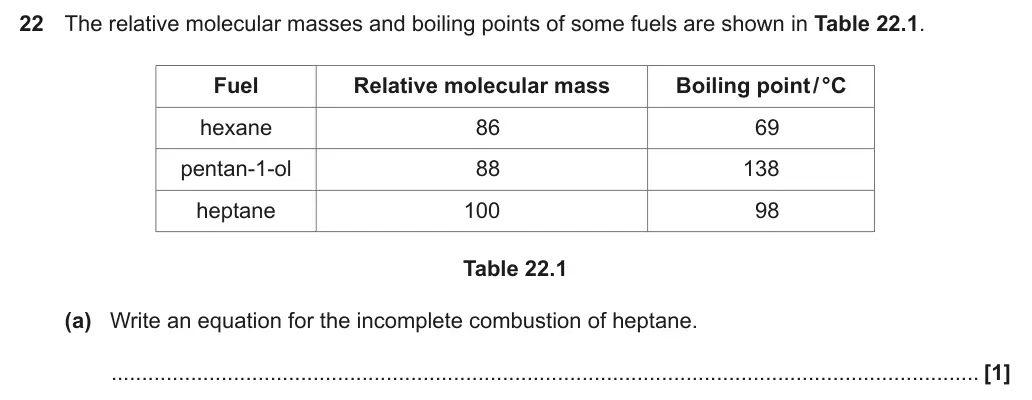
June 2018 · Paper 2 · Q22(b) 4 marks Data interpretation Easy alkanesbonding and structurealcohols
Earlier part of question 22 that this part usesEarlier part of June 2018 Paper 2 question 22
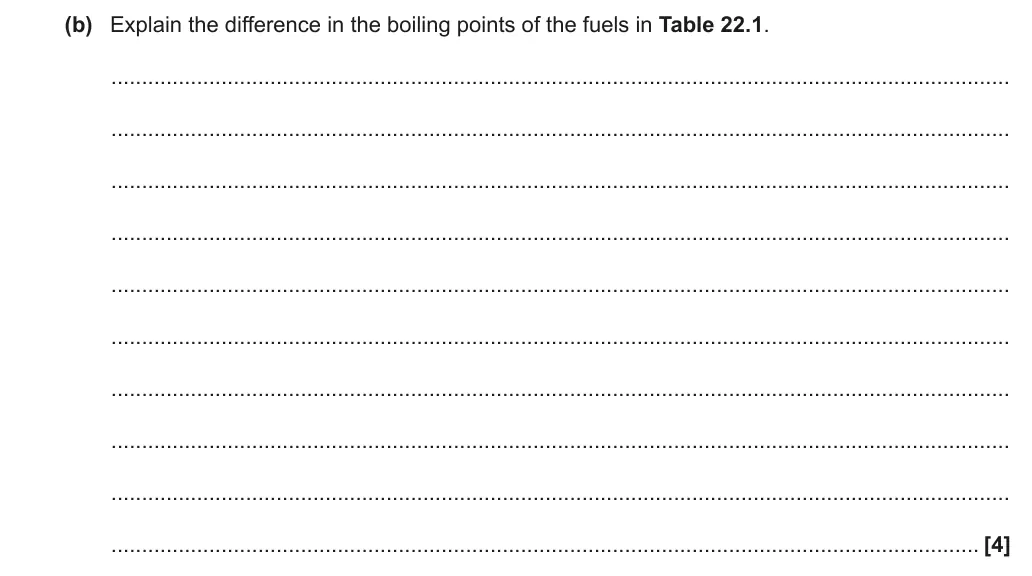
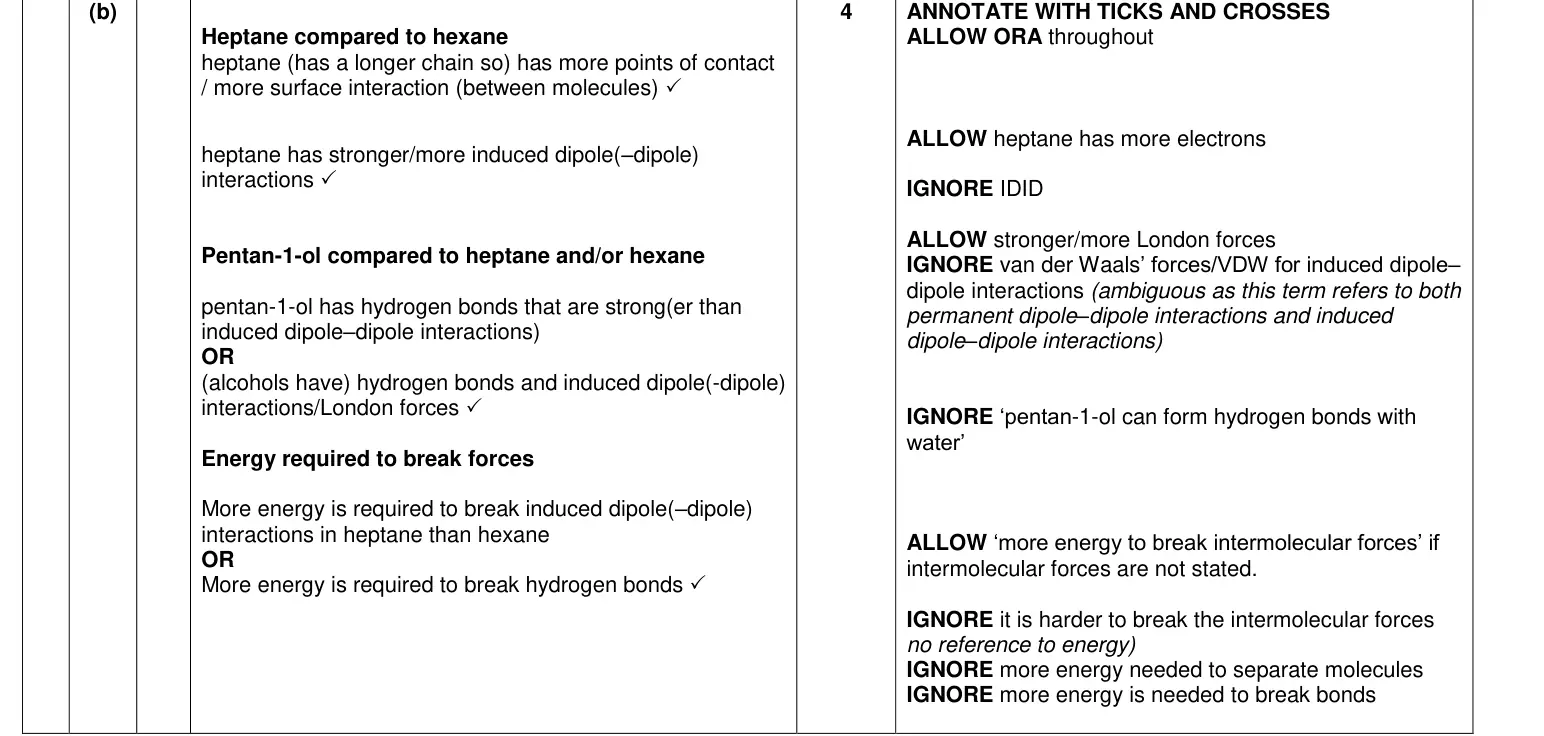
(b) Explain the difference in the boiling points of the fuels in Table 22.1.
...................................................................................................................................................
...................................................................................................................................................
...................................................................................................................................................
...................................................................................................................................................
...................................................................................................................................................
...................................................................................................................................................
...................................................................................................................................................
...................................................................................................................................................
...................................................................................................................................................
.............................................................................................................................................. [4]
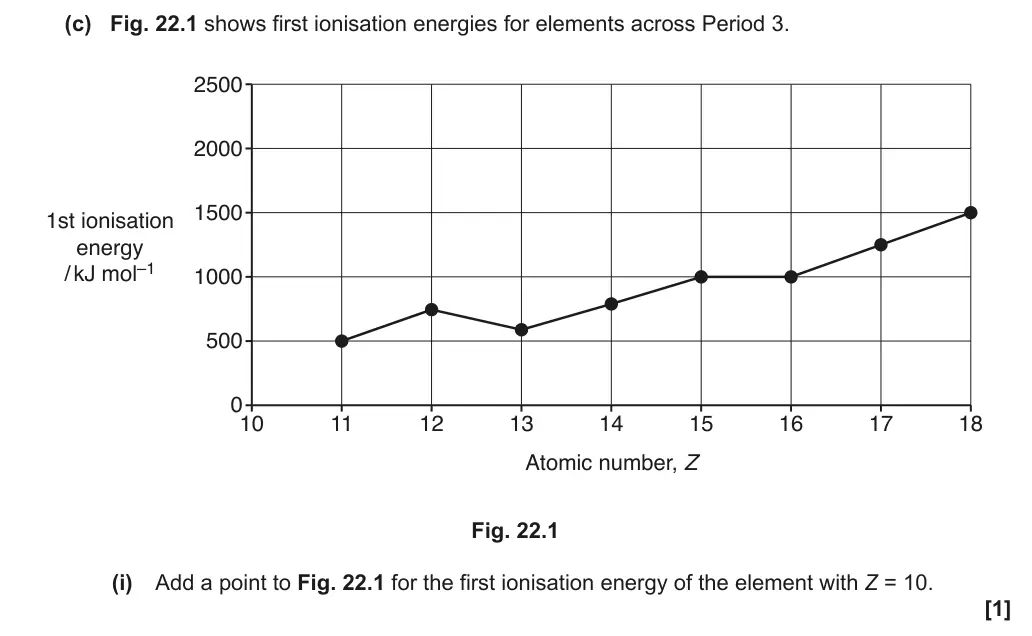
June 2017 · AS Paper 1 · Q22(c)(iii) 3 marks Data interpretation periodicity
Earlier part of question 22 that this part usesEarlier part of June 2017 Paper 1 question 22
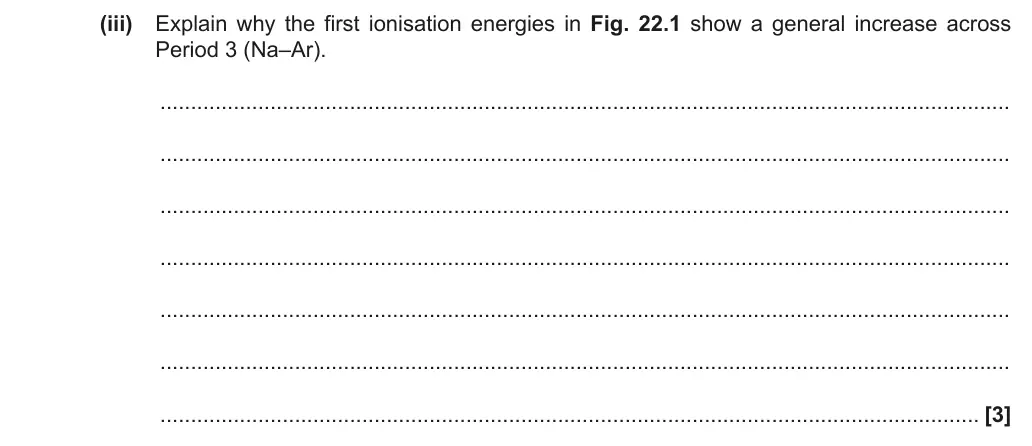
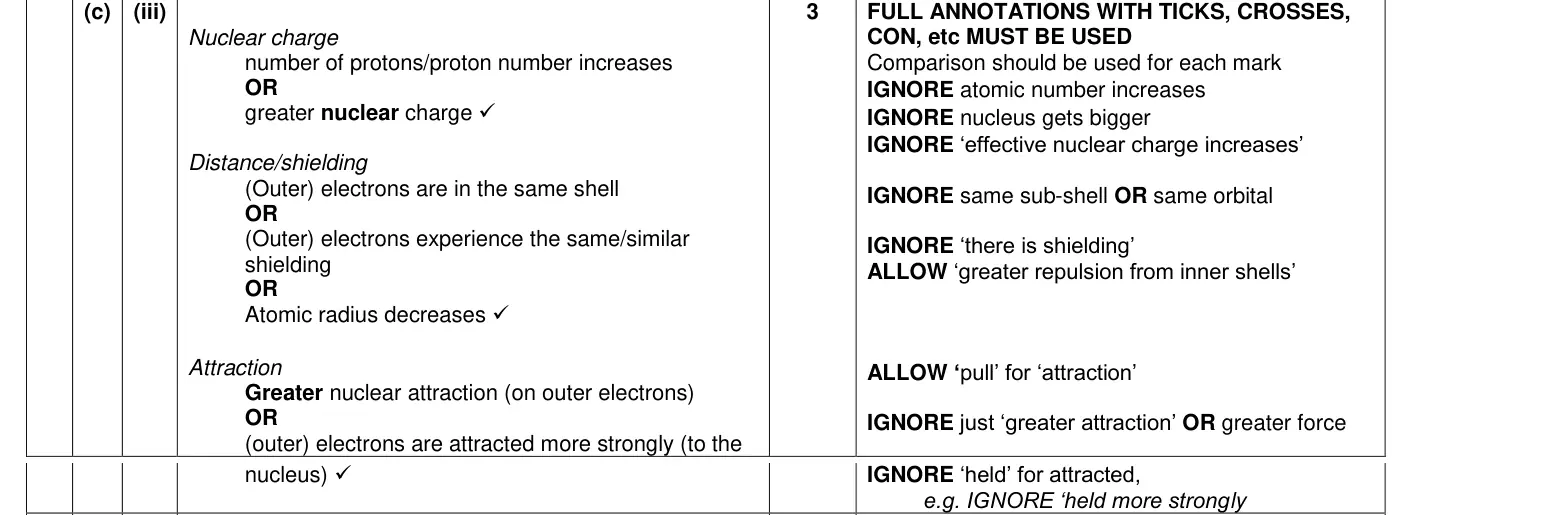
(iii) Explain why the first ionisation energies in Fig. 22.1 show a general increase across
Period 3 (Na–Ar).
...........................................................................................................................................
...........................................................................................................................................
...........................................................................................................................................
...........................................................................................................................................
...........................................................................................................................................
...........................................................................................................................................
...................................................................................................................................... [3]
June 2017 · AS Paper 1 · Q24(b)(ii) 2 marks Data interpretation redox
Earlier part of question 24 that this part usesEarlier part of June 2017 Paper 1 question 24
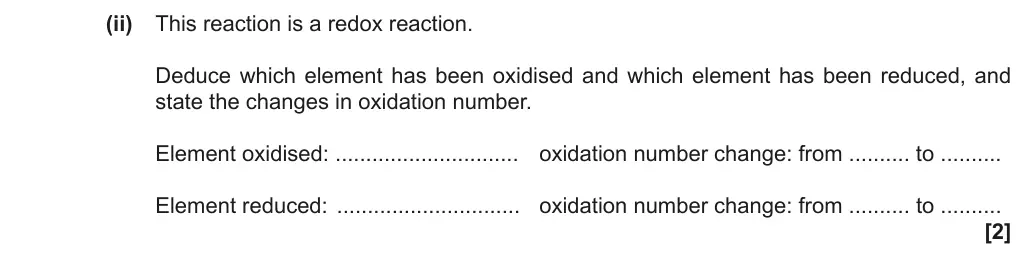
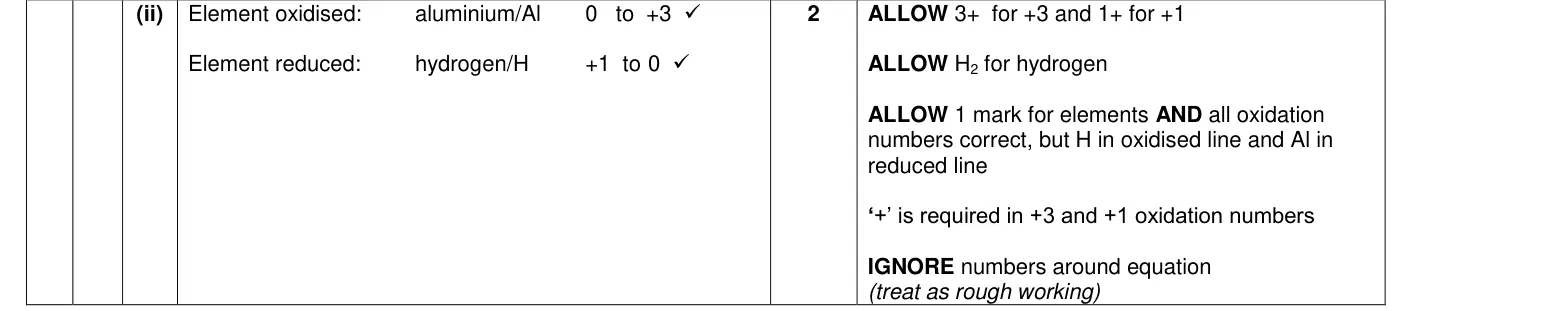
(ii) This reaction is a redox reaction.
Deduce which element has been oxidised and which element has been reduced, and
state the changes in oxidation number.
Element oxidised: ..............................  oxidation number change: from .......... to ..........
Element reduced:  ..............................  oxidation number change: from .......... to ..........
[2]
June 2017 · Paper 1 · Q17(c)(i) 3 marks Data interpretation halogensredox
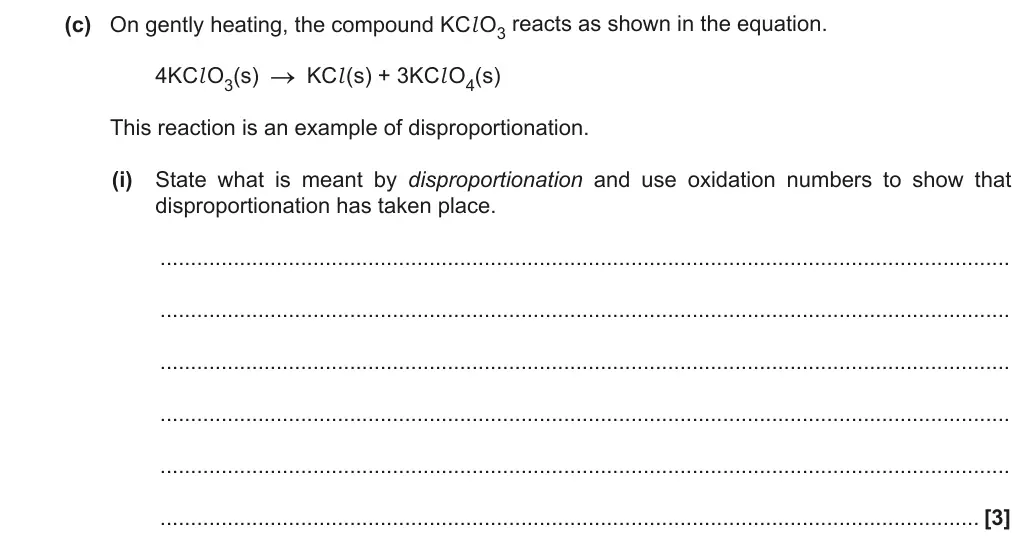
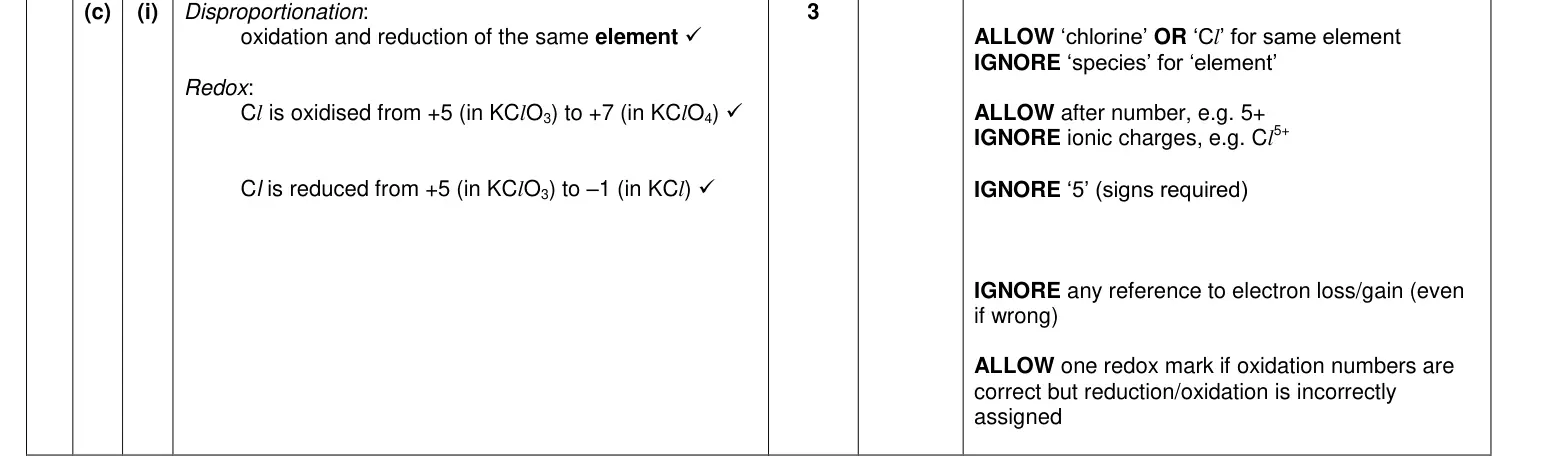
(c) On gently heating, the compound KCl O3 reacts as shown in the equation.
4KCl O3(s) KCl (s) + 3KCl O4(s)
This reaction is an example of disproportionation.
(i) State what is meant by disproportionation and use oxidation numbers to show that
disproportionation has taken place.
...........................................................................................................................................
...........................................................................................................................................
...........................................................................................................................................
...........................................................................................................................................
...........................................................................................................................................
...................................................................................................................................... [3]
June 2017 · Paper 1 · Q18(a) 4 marks Data interpretation entropy and free energy
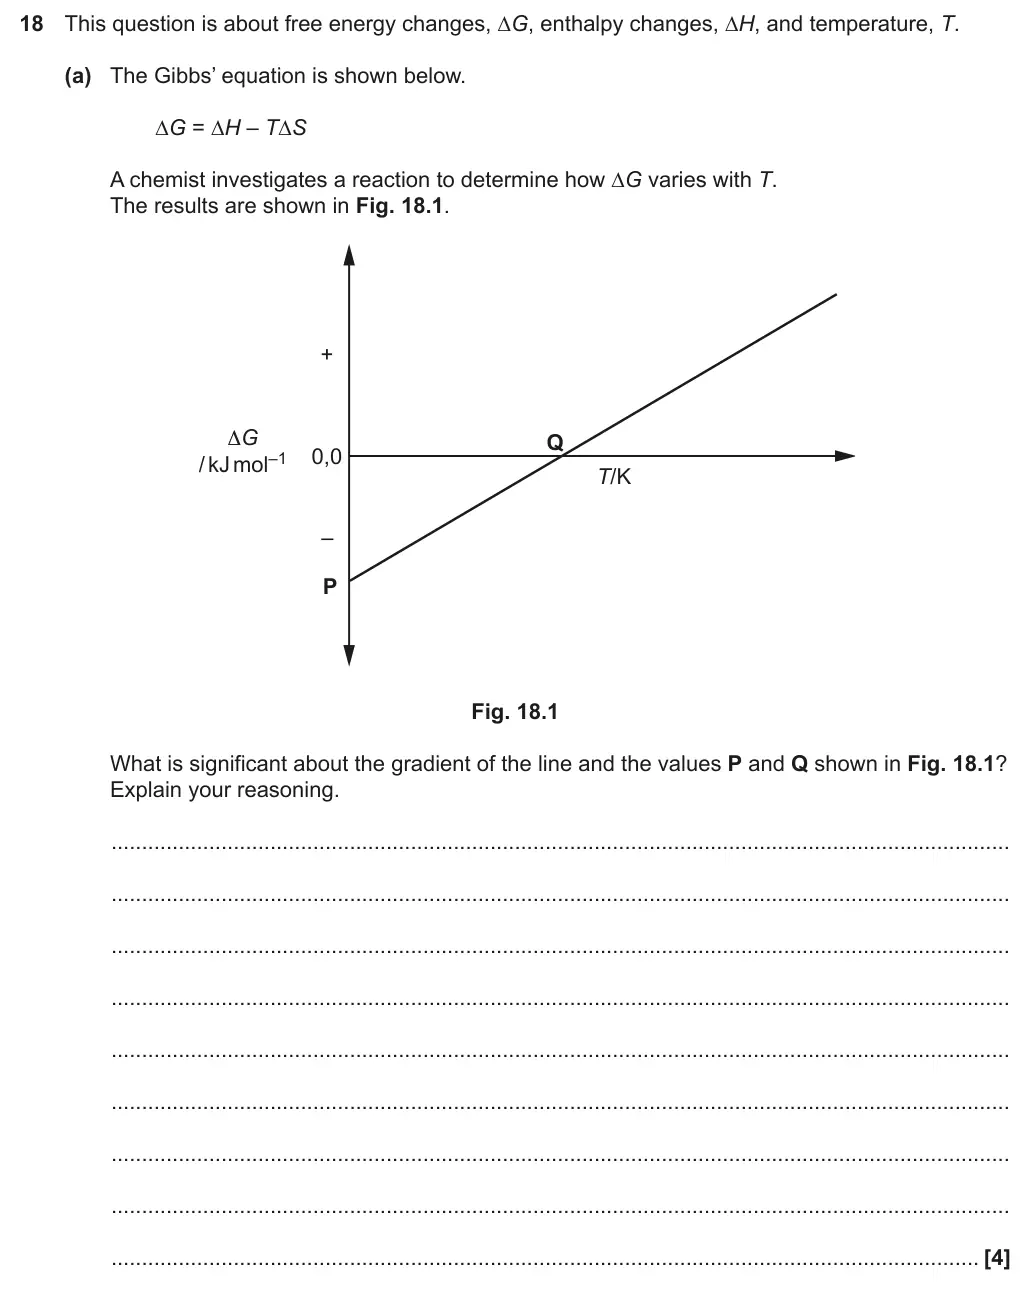
18 This question is about free energy changes, ∆G, enthalpy changes, ∆H, and temperature, T.
(a) The Gibbs’ equation is shown below.
∆G = ∆H – T∆S
A chemist investigates a reaction to determine how ∆G varies with T.
The results are shown in Fig. 18.1.
+
ΔG Q
/ kJ mol–1 0,0
T/K
–
P
Fig. 18.1
What is significant about the gradient of the line and the values P and Q shown in Fig. 18.1?
Explain your reasoning.
...................................................................................................................................................
...................................................................................................................................................
...................................................................................................................................................
...................................................................................................................................................
...................................................................................................................................................
...................................................................................................................................................
...................................................................................................................................................
...................................................................................................................................................
.............................................................................................................................................. [4]
June 2017 · Paper 1 · Q22(b) 2 marks Data interpretation redox and electrode potentials
Earlier part of question 22 that this part usesEarlier part of June 2017 Paper 1 question 22
(b) In Table 22.1, what is the strongest reducing agent and the strongest oxidising agent?
Strongest reducing agent ..........................................................................................................
Strongest oxidising agent ..........................................................................................................
[2]
June 2017 · Paper 2 · Q17(b)(i) 1 mark Data interpretation aromatic compoundspractical skills
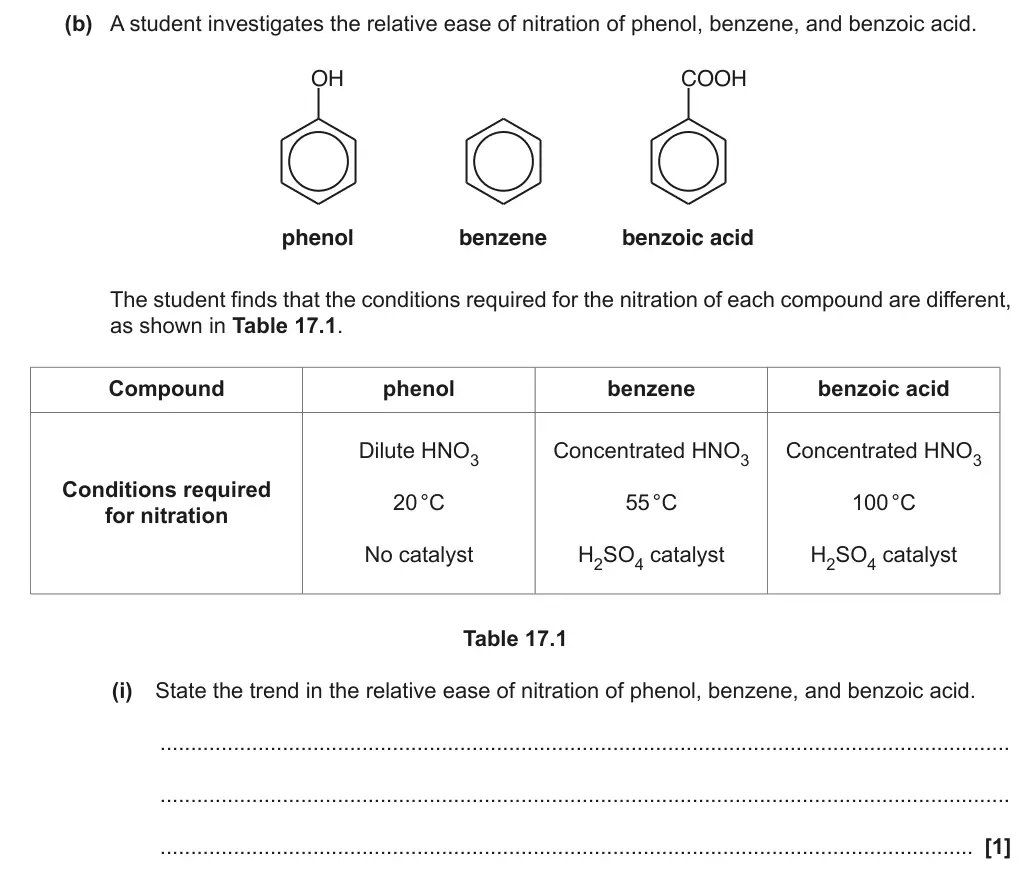
(b) A student investigates the relative ease of nitration of phenol, benzene, and benzoic acid.
OH COOH
phenol benzene benzoic acid
The student finds that the conditions required for the nitration of each compound are different,
as shown in Table 17.1.
Compound phenol benzene benzoic acid
Dilute HNO3 Concentrated HNO3 Concentrated HNO3
Conditions required
20 °C 55 °C 100 °C
for nitration
No catalyst H2SO4 catalyst H2SO4 catalyst
Table 17.1
(i) State the trend in the relative ease of nitration of phenol, benzene, and benzoic acid.
...........................................................................................................................................
...........................................................................................................................................
..................................................................................................................................... [1]
June 2017 · Paper 2 · Q19(b)(ii) 1 mark Data interpretation alcohols
Earlier part of question 19 that this part usesEarlier part of June 2017 Paper 2 question 19
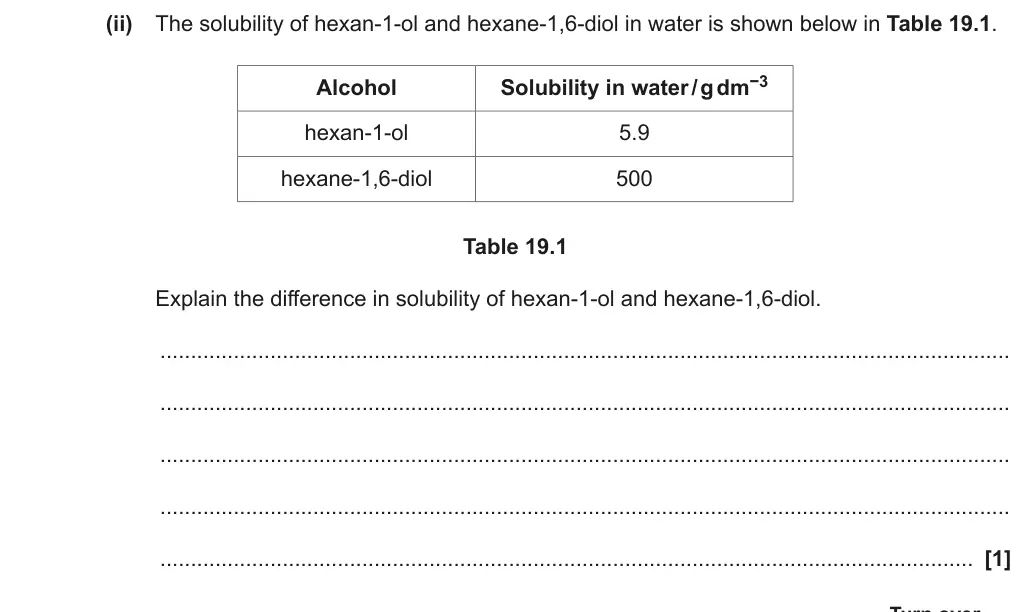
(ii) The solubility of hexan-1-ol and hexane-1,6-diol in water is shown below in Table 19.1.
Alcohol Solubility in water / g dm−3
hexan-1-ol 5.9
hexane-1,6-diol 500
Table 19.1
Explain the difference in solubility of hexan-1-ol and hexane-1,6-diol.
...........................................................................................................................................
...........................................................................................................................................
...........................................................................................................................................
...........................................................................................................................................
..................................................................................................................................... [1]
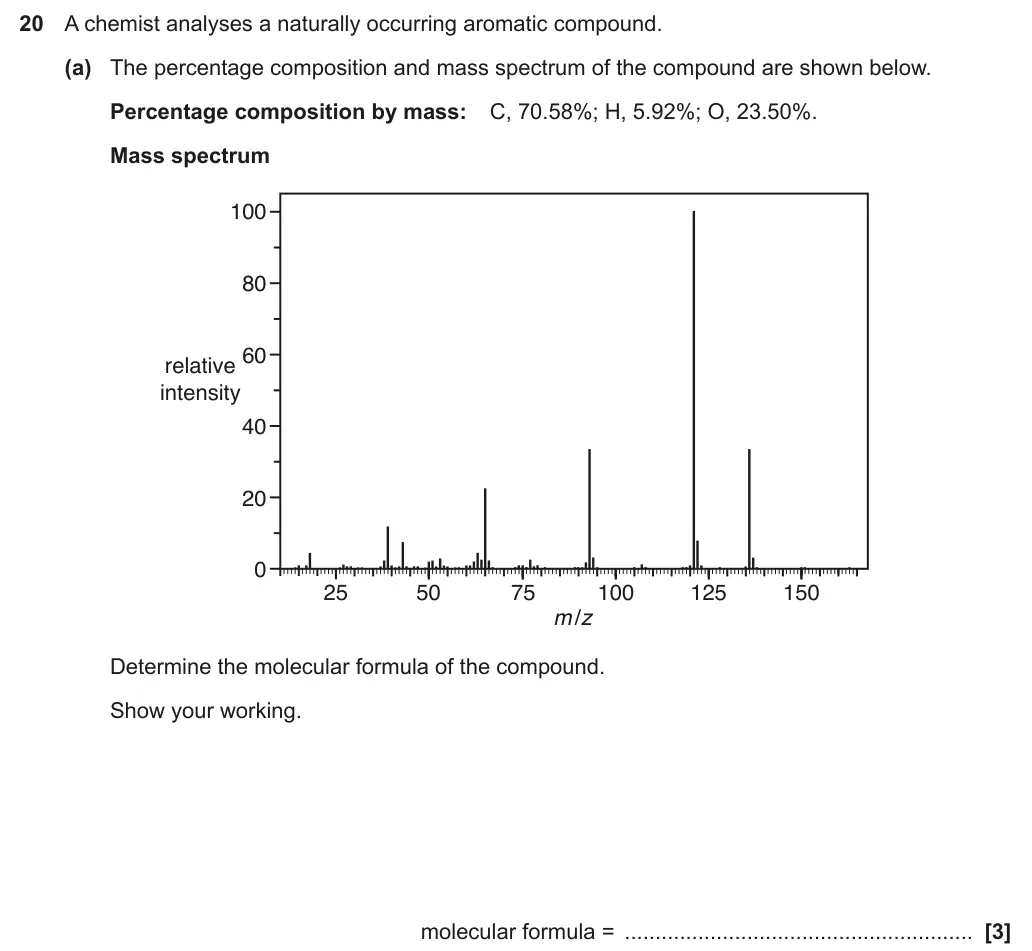
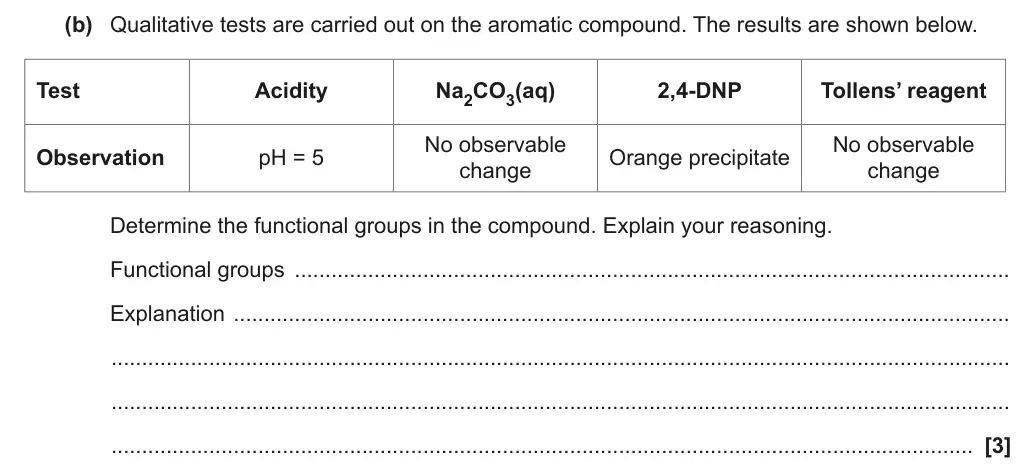
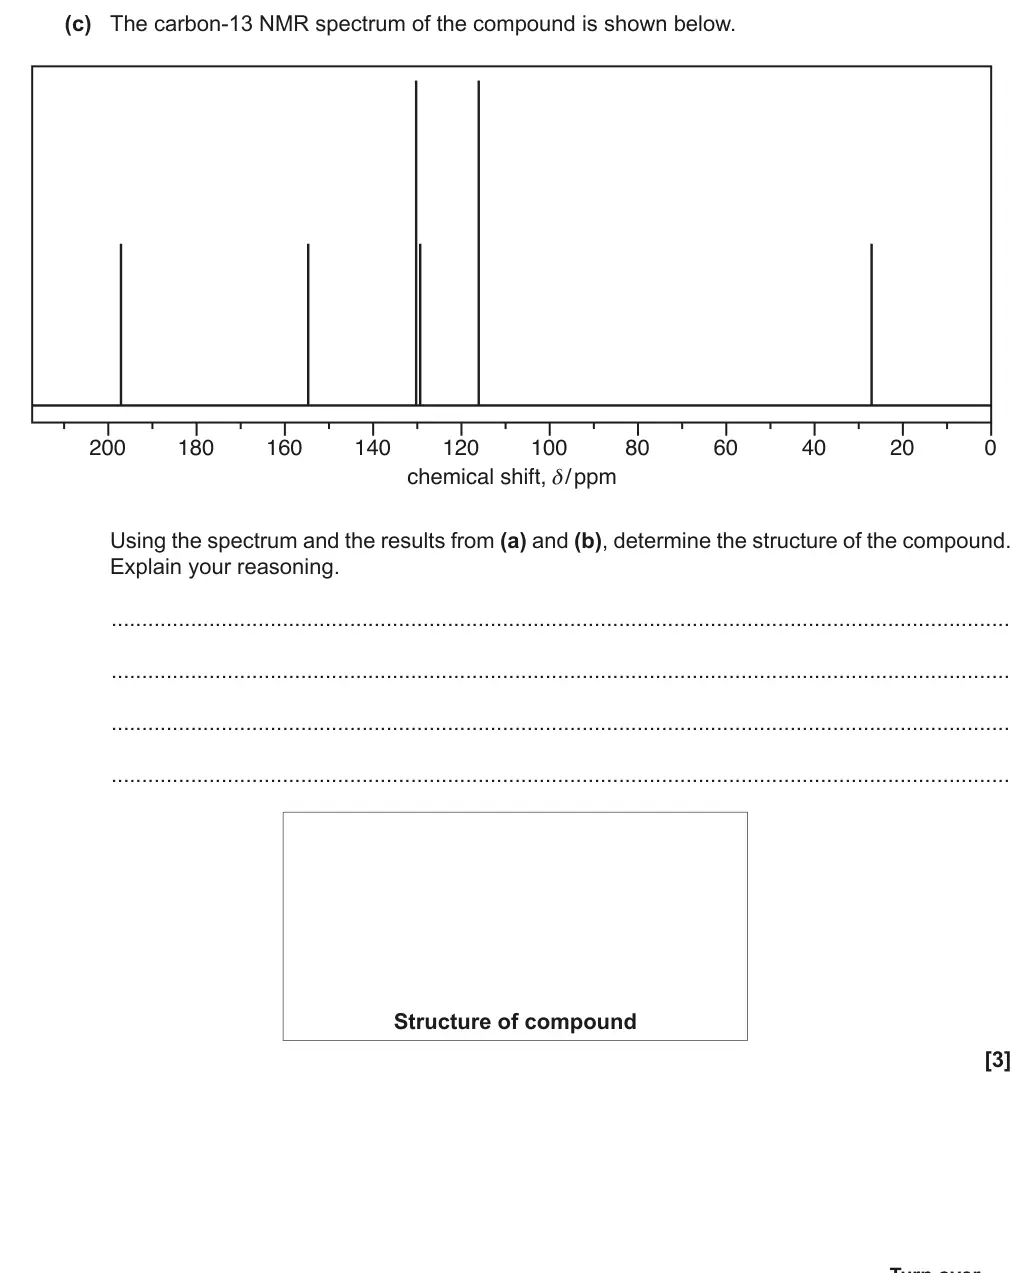
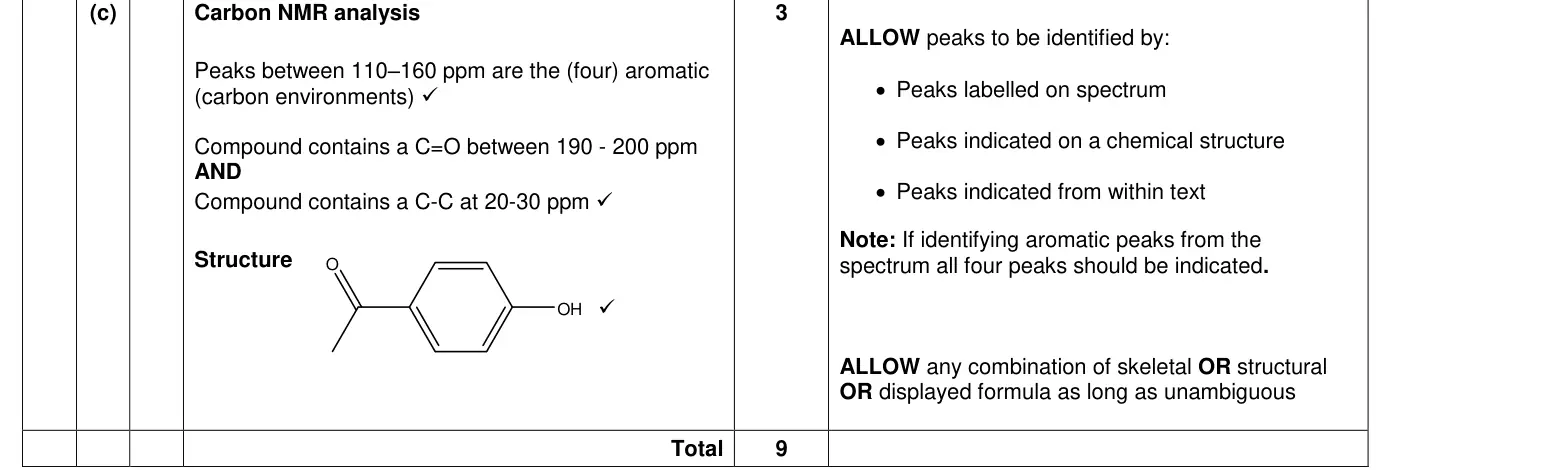
June 2017 · Paper 2 · Q20(c) 3 marks Data interpretation nmr spectroscopy
Earlier parts of question 20 that this part usesEarlier part of June 2017 Paper 2 question 20Earlier part of June 2017 Paper 2 question 20
(c) The carbon-13 NMR spectrum of the compound is shown below.
200 180 160 140 120 100 80 60 40 20 0
chemical shift,   / ppm δ
Using the spectrum and the results from (a) and (b), determine the structure of the compound.
Explain your reasoning.
...................................................................................................................................................
...................................................................................................................................................
...................................................................................................................................................
...................................................................................................................................................
Structure of compound
[3]

Work with an OCR chemistry tutor

Dropping marks on calculations, mechanisms or the six-markers? Book a trial session with a specialist OCR chemistry tutor.

Prefer email? Send an enquiry

If you are under 18, please include a parent's contact details. Enquiries go to enquiries@chemistryaleveltutor.com and are deleted once handled. All tutoring is online.